

Asian Fixed Income: Are we at a turning point?
Despite a volatile market environment, Asian fixed income posted positive performance in the first half of 2025. However, with macroeconomic uncertainty still lingering, investors are keen to understand potential opportunities and risks moving forward. In this 2025 Second-Half Outlook, Murray Collis, Head of Asia Fixed Income, analyses the near-term tailwinds propelling returns, as well as the structural fundamentals and shifting geopolitical trends that could support the asset class over the long-term.


A volatile start to the year
The first half of 2025 unfolded against a backdrop of heightened macroeconomic uncertainty. Geopolitical tensions and a shift in US trade policy—most notably the imposition of steep Liberation Day tariffs on 2 April, followed by a 90-day freeze—sparked volatility across global markets. Investors were prompted to reassess their exposure to US dollar assets amid growing concerns over policy direction and fiscal sustainability.
Despite this turbulence, Asian fixed income markets delivered solid first-half returns. As of 30 June, Asian local currency bonds were up by +7.6% year-to-date, while Asian credit remained resilient with a +3.8% gain. Looking forward, we believe Asian fixed income is well-positioned to build on this momentum and deliver attractive full-year returns.
US sovereign downgrade: A catalyst for reallocation
On 16 May, Moody’s downgraded its US sovereign credit rating from AAA to Aa1, following similar moves by Fitch in 2023 and S&P in 2011. This marked the loss of the US’s final AAA rating among the three major agencies. Moody’s cited several key concerns:
- A sharp rise in federal debt levels
- Persistent fiscal deficits over the past decade
- Projections for the US debt-to-GDP ratio rising from 98% in 2024 to 134% by 2035
As these metrics are significantly worse than other AAA rated sovereigns, Moody’s decided to proceed with the downgrade. This move led global investors to re-evaluate their allocations to US Treasuries, which had long been considered the cornerstone of “risk-free” assets. The erosion of this status, combined with increasing fiscal uncertainty, has naturally directed investors to ponder suitable investment alternatives.
Asian bonds: A stable alternative
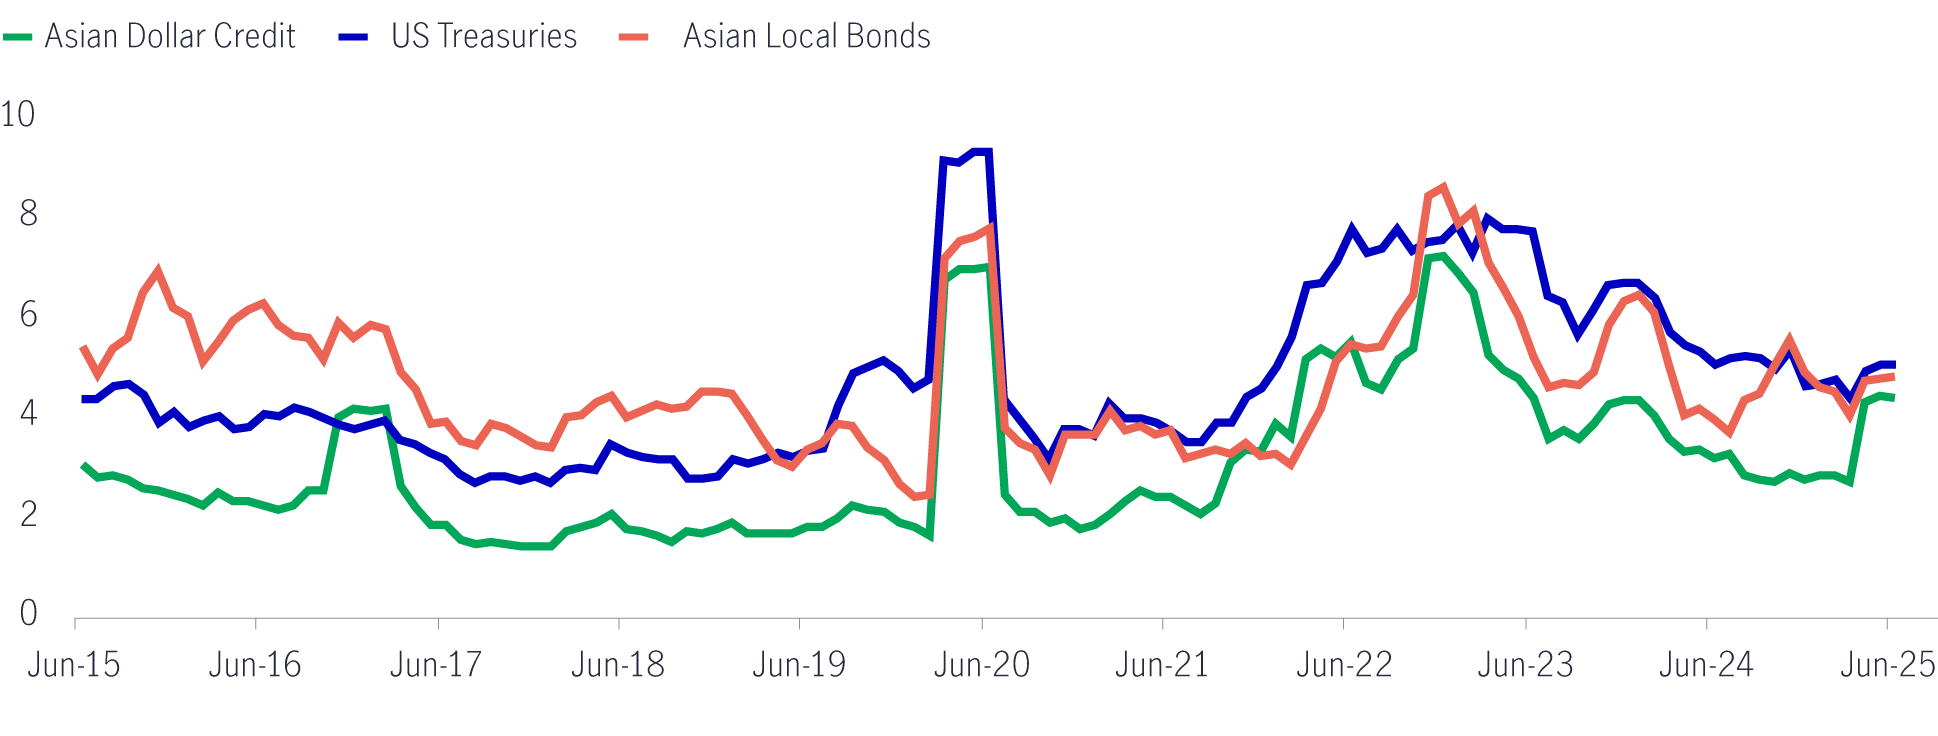
Even before the downgrade, US Treasuries had shown greater volatility than Asian credit and local currency bonds (see Chart 1)—despite their perceived safety. This volatility has been driven by policy uncertainty, rising debt burdens, and shifting global dynamics.
In contrast, Asian bonds have, arguably, offered more stable total returns in recent years, supported by improving economic fundamentals and diversified regional dynamics. This relative constancy makes them an increasingly attractive option for investors seeking to reduce overall portfolio volatility.
Chart 1: Historical 90-day volatility of Asian bonds versus US Treasuries1
AAA-rated Asia-Pacific Bonds
For investors seeking to maintain exposure to AAA rated bonds without taking on additional currency risk, regional markets such as Singapore and Australia offer compelling alternatives.
Both countries retain AAA ratings from all three major agencies due to their strong fundamentals and prudent fiscal management, making them appealing to investors prioritising quality and stability. Select hard-currency credits in these markets—particularly in the quasi-sovereign space—may even trade at negative credit spreads relative to US Treasuries, reflecting their perceived lower credit risk.
Asian local currency bonds: High-quality, high-yielding
Interest in Asian local currency bonds is expected to grow in line with the emerging de-dollarisation trend. These markets offer high-quality alternatives to US Treasuries, along with meaningful diversification benefits.
Chart 2: Sovereign rating with 10-year bond yields2
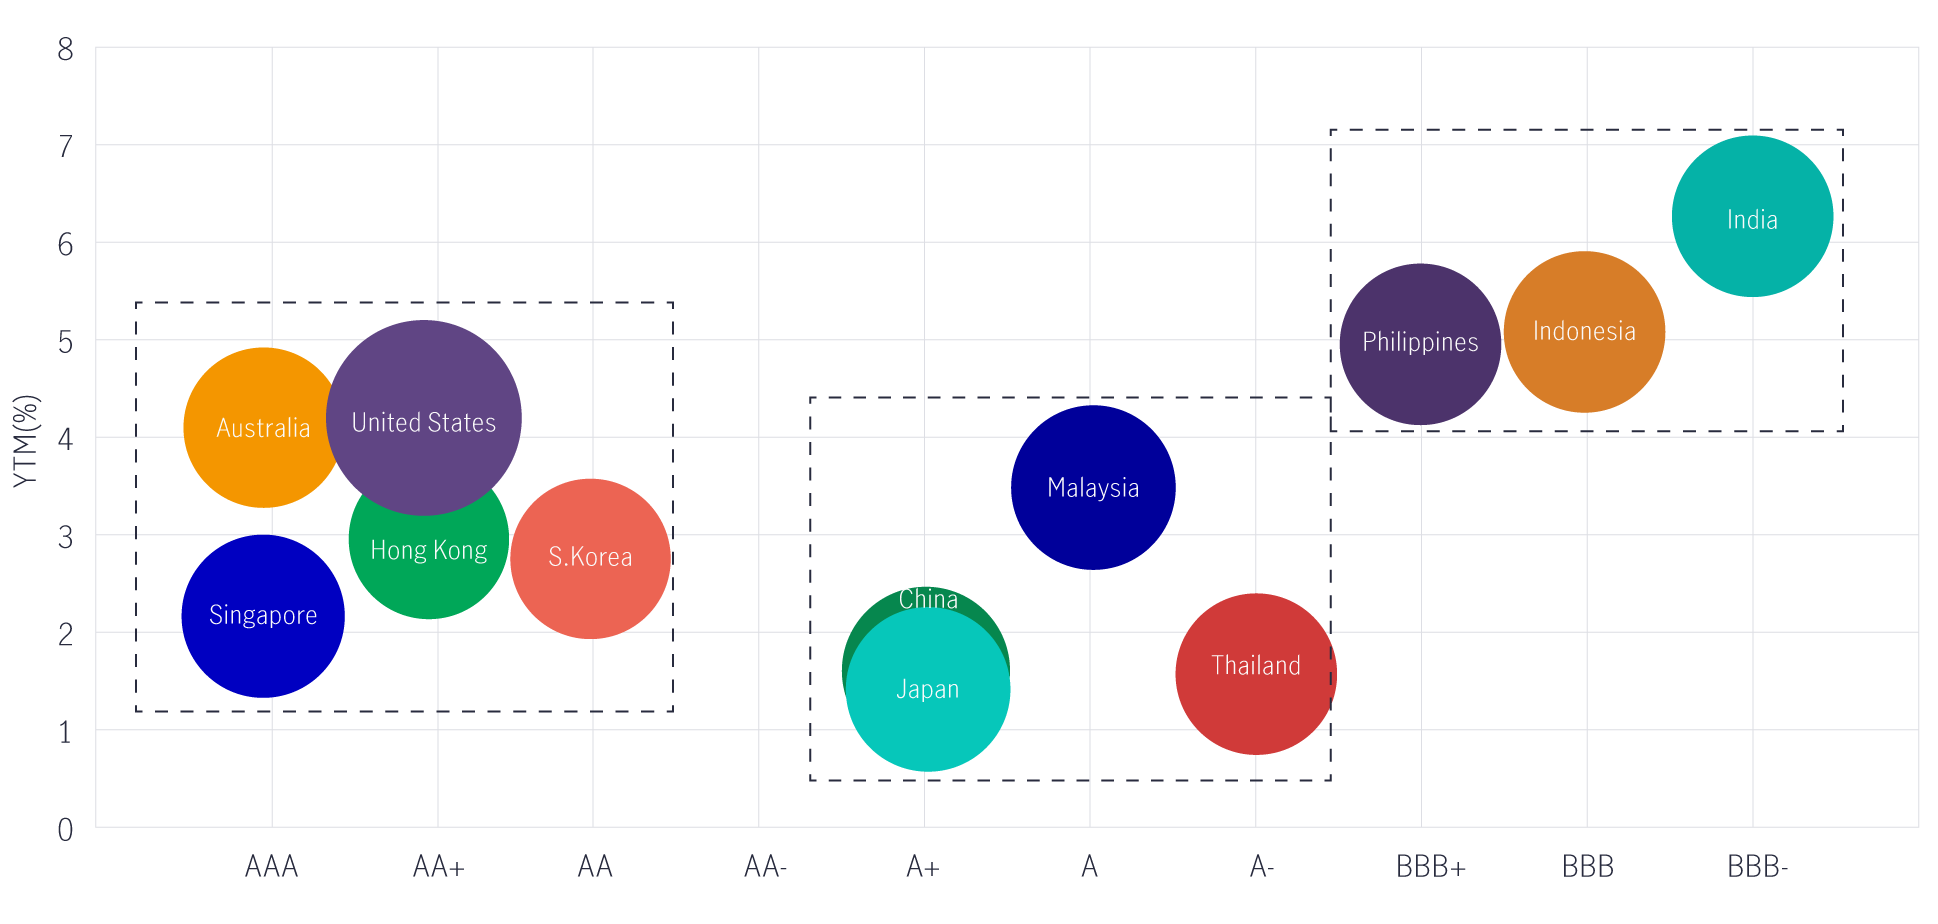
All 11 Asia-Pacific markets in our universe are rated investment grade (BBB- or above), and can be grouped as follows (see Chart 2):
AAA to AA-rated:
- Australia, Singapore (AAA), Hong Kong (AA+), South Korea (AA)
- Yields: 2.2% – 4.1%
Single-A rated:
- China, Japan (A+), Malaysia (A), Thailand (A-)
- Yields: 1.4% – 3.5%
BBB-rated (high yielders):
- Philippines (BBB+), Indonesia (BBB), India (BBB-)
- Yields: 5.0% – 6.3% (unhedged)
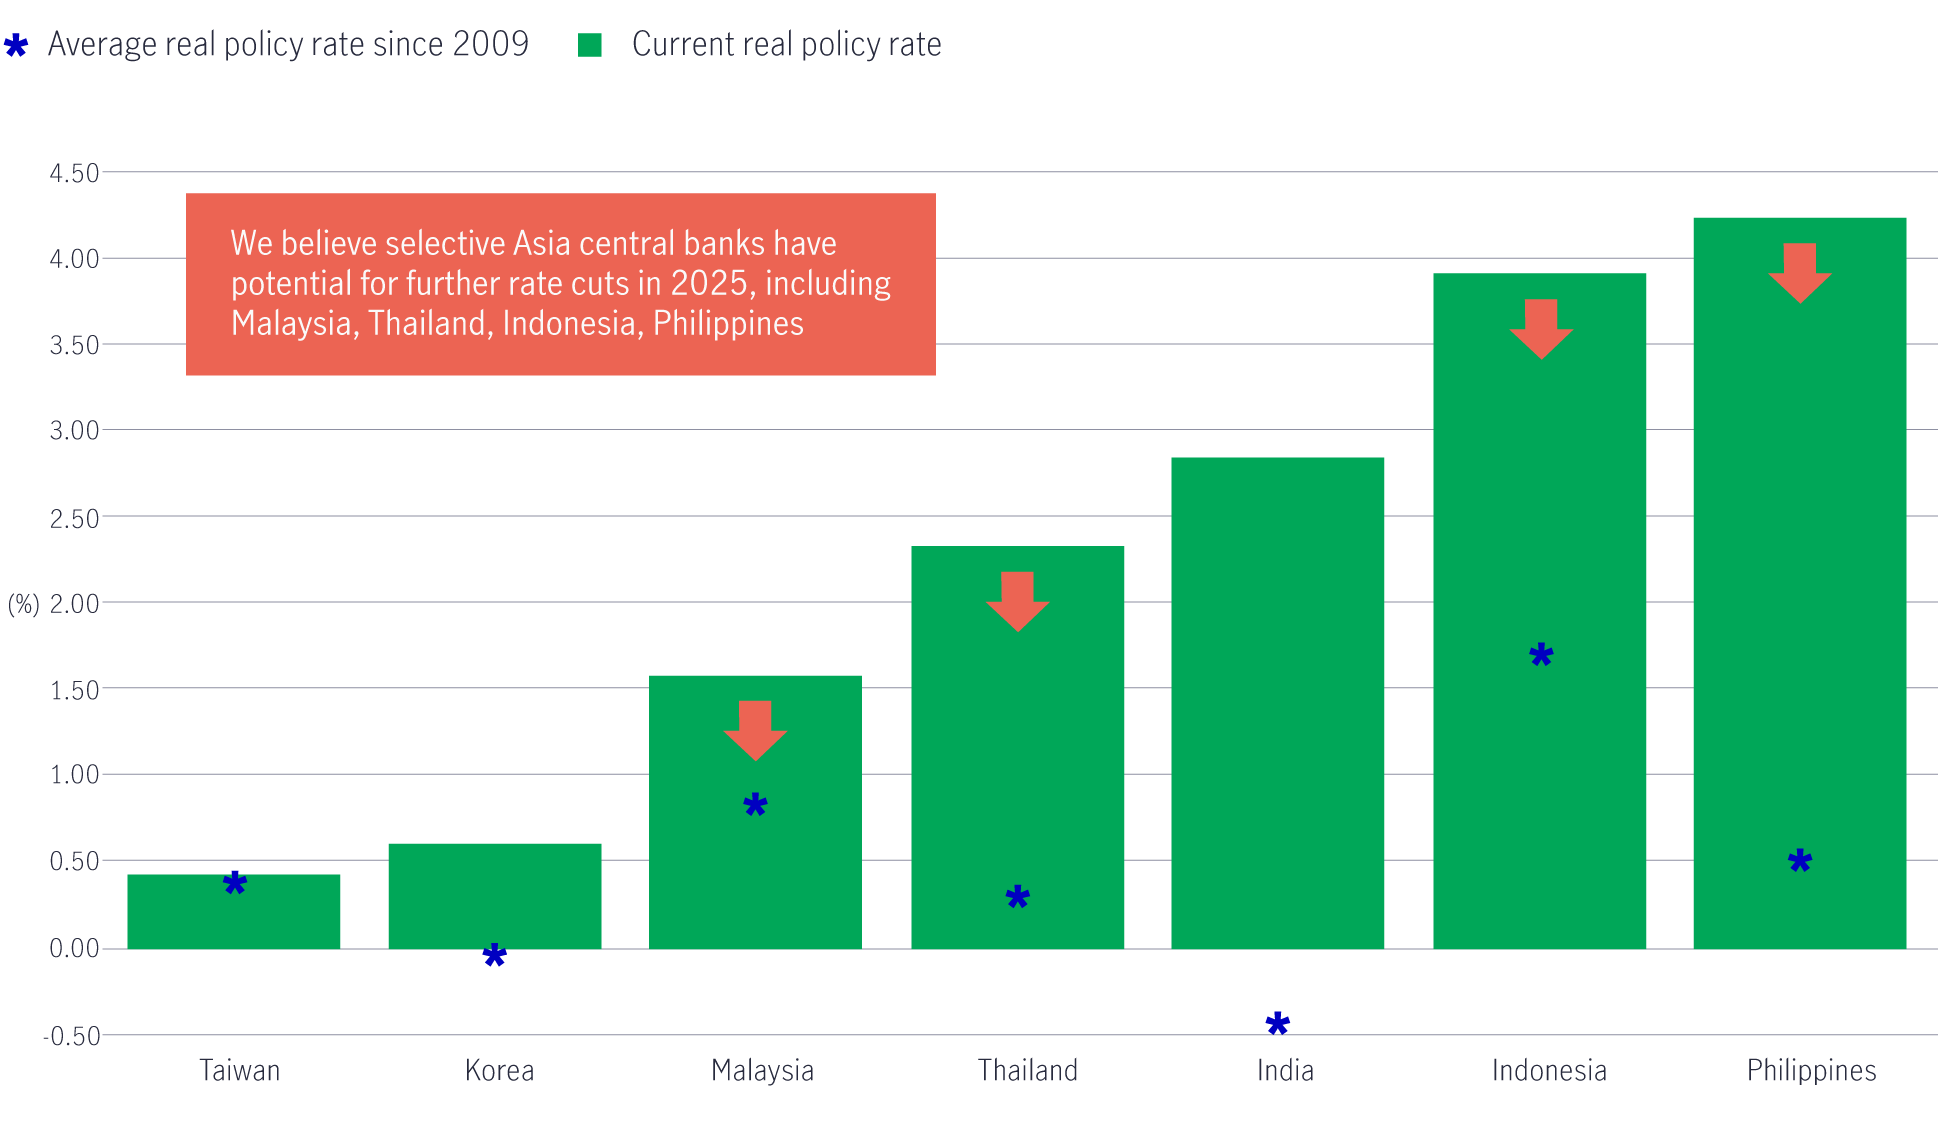
The weaker US dollar has given Asian central banks room to cut policy rates to support domestic growth and mitigate the impact of US tariffs (see Chart 3). Thus far this year, India, Indonesia, mainland China, Malaysia, the Philippines, South Korea, and Thailand have already implemented rate cuts. Looking ahead, we expect that some of these markets may continue to ease monetary policy—further boosting returns in local currency bond markets (see Chart 3).
Chart 3: Key Asian central bank (real) policy rates3
Currency outlook: A case for selective unhedged exposure
We believe that selective unhedged currency exposure, actively managed, can enhance diversification and improve risk-adjusted returns for US dollar-based investors.
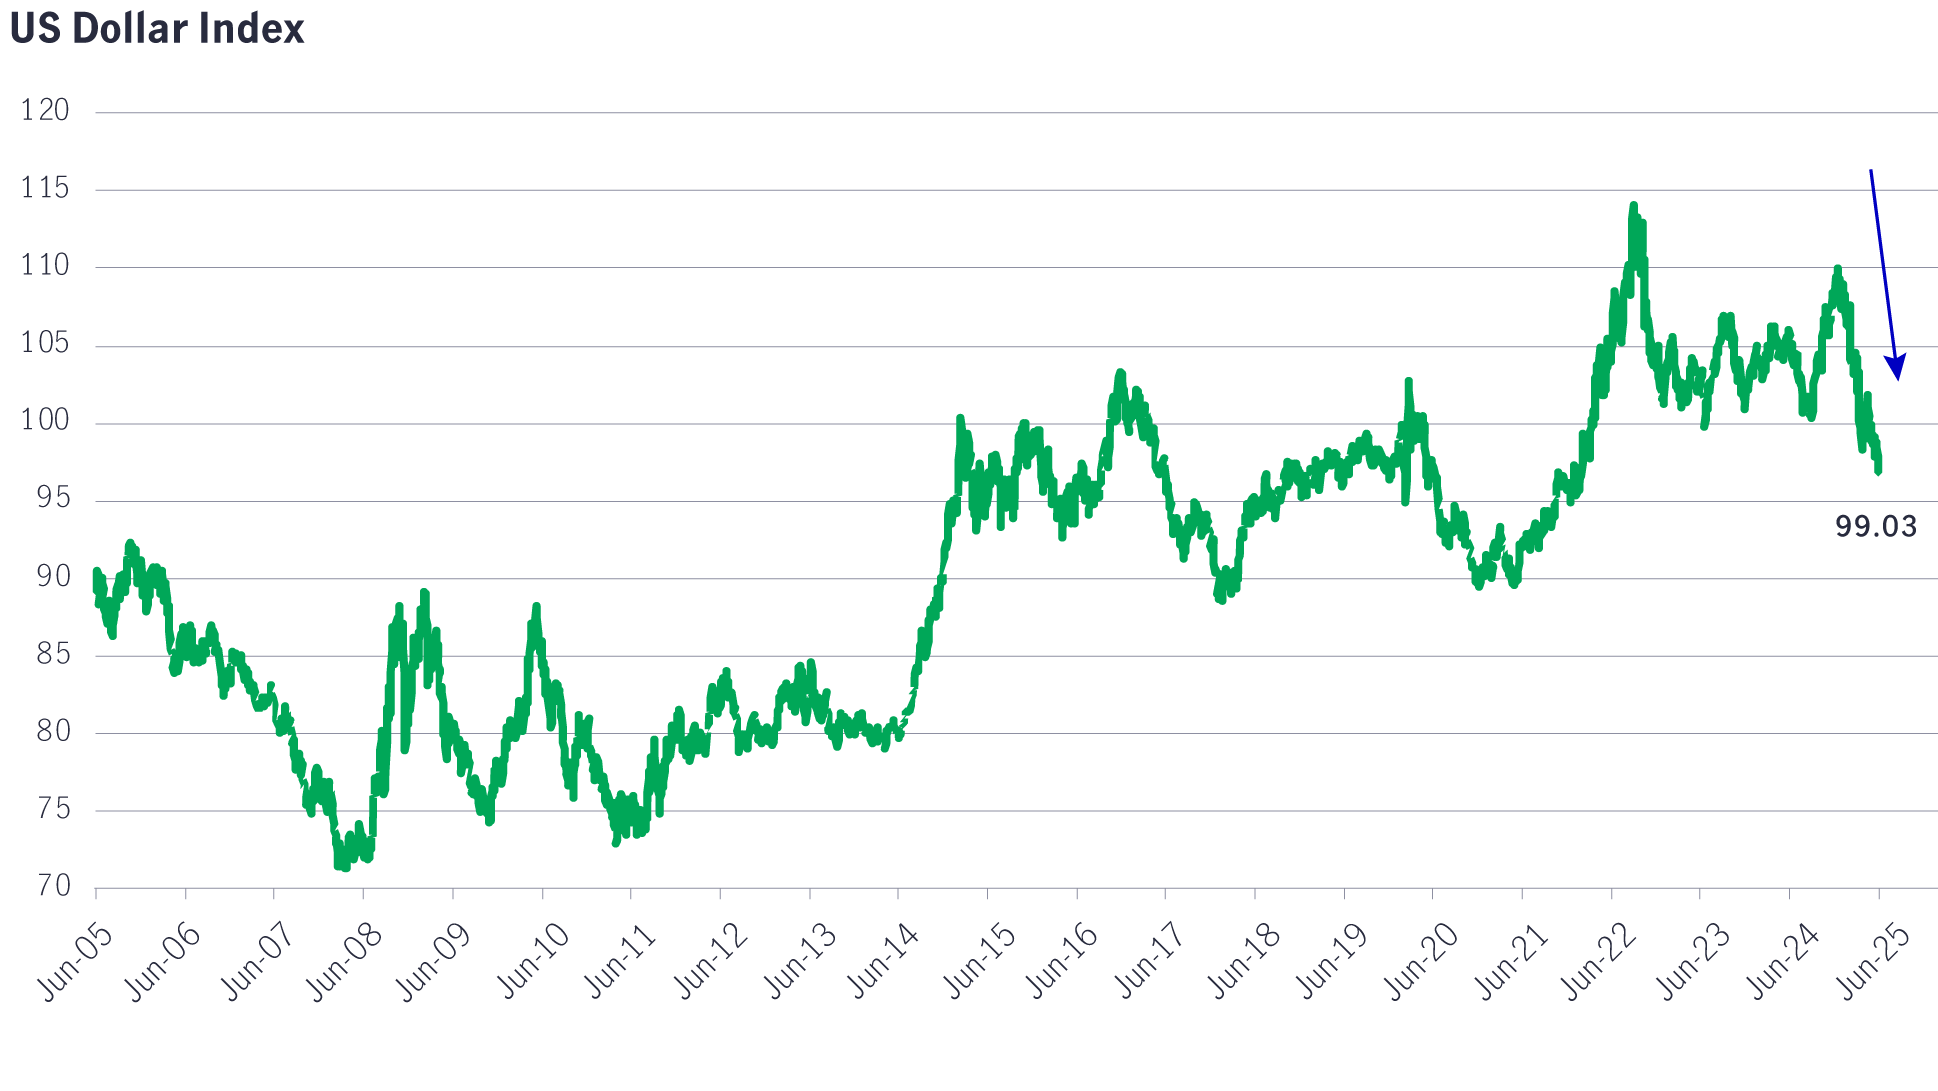
The US dollar has enjoyed a strong run over the past five years, with the DXY index rising from roughly 89 to 108 by the end of 2024. These gains were underpinned by US economic outperformance and attractive asset returns. However, recent fiscal and trade policy shifts have introduced significant uncertainty, culminating in the loss of the US’s final AAA rating.
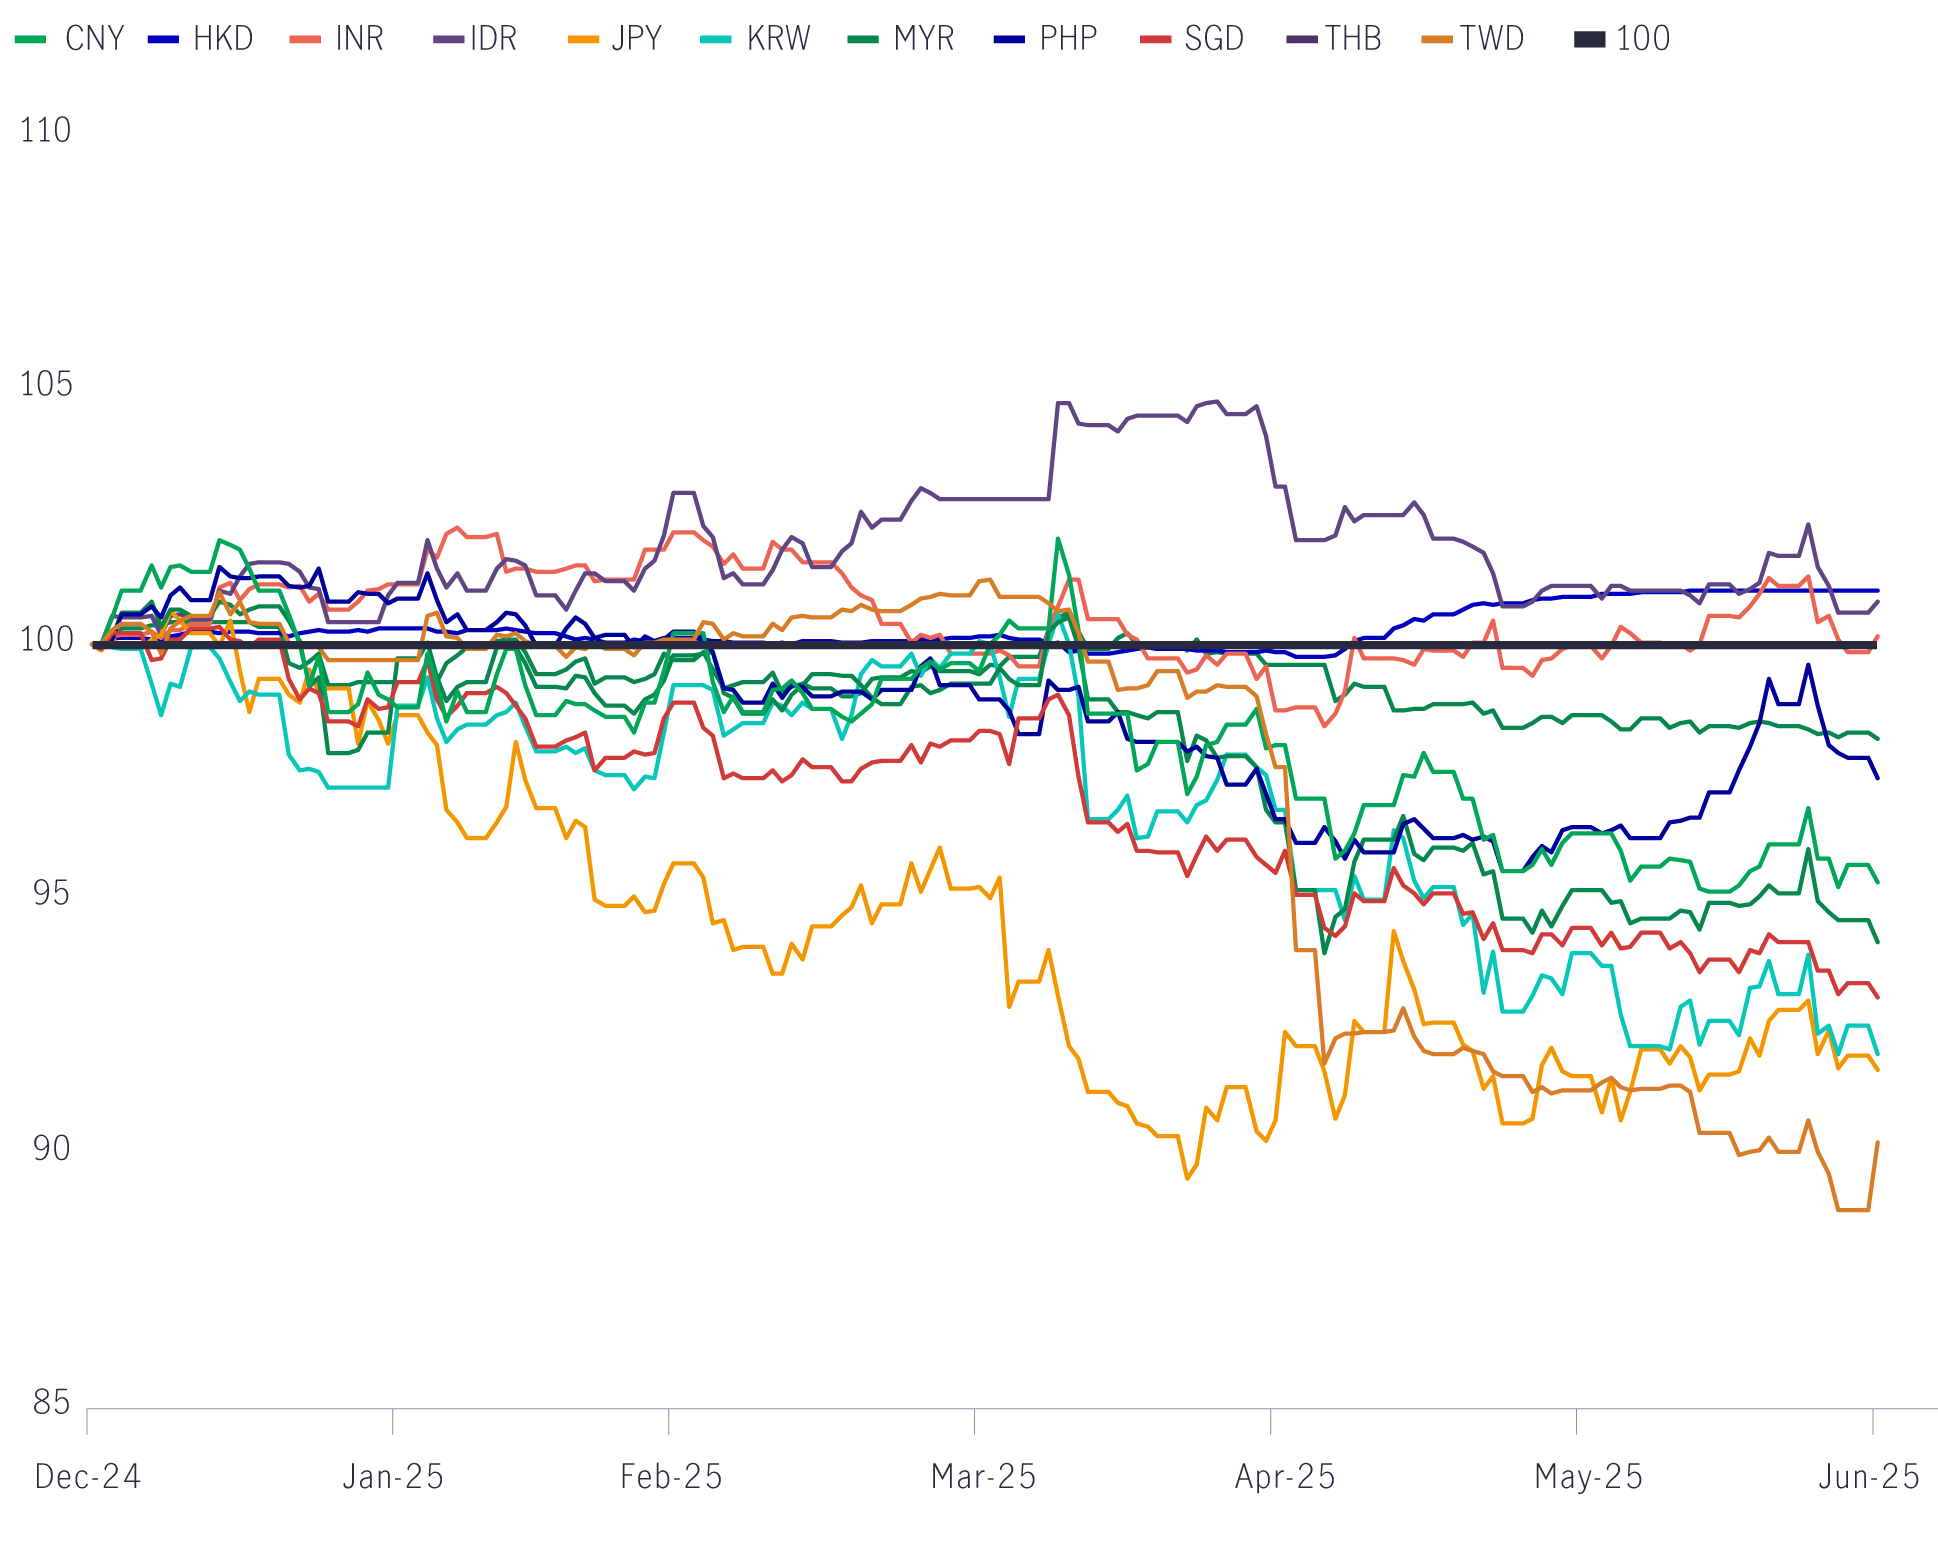
These developments have increased the likelihood of a slowing US economy and a weaker dollar in the second half of 2025. While a broad exodus from US dollar assets is unlikely in the near term, we are seeing signs of repatriation and increased hedging, contributing to high single-digit gains in several Asian currencies year-to-date.
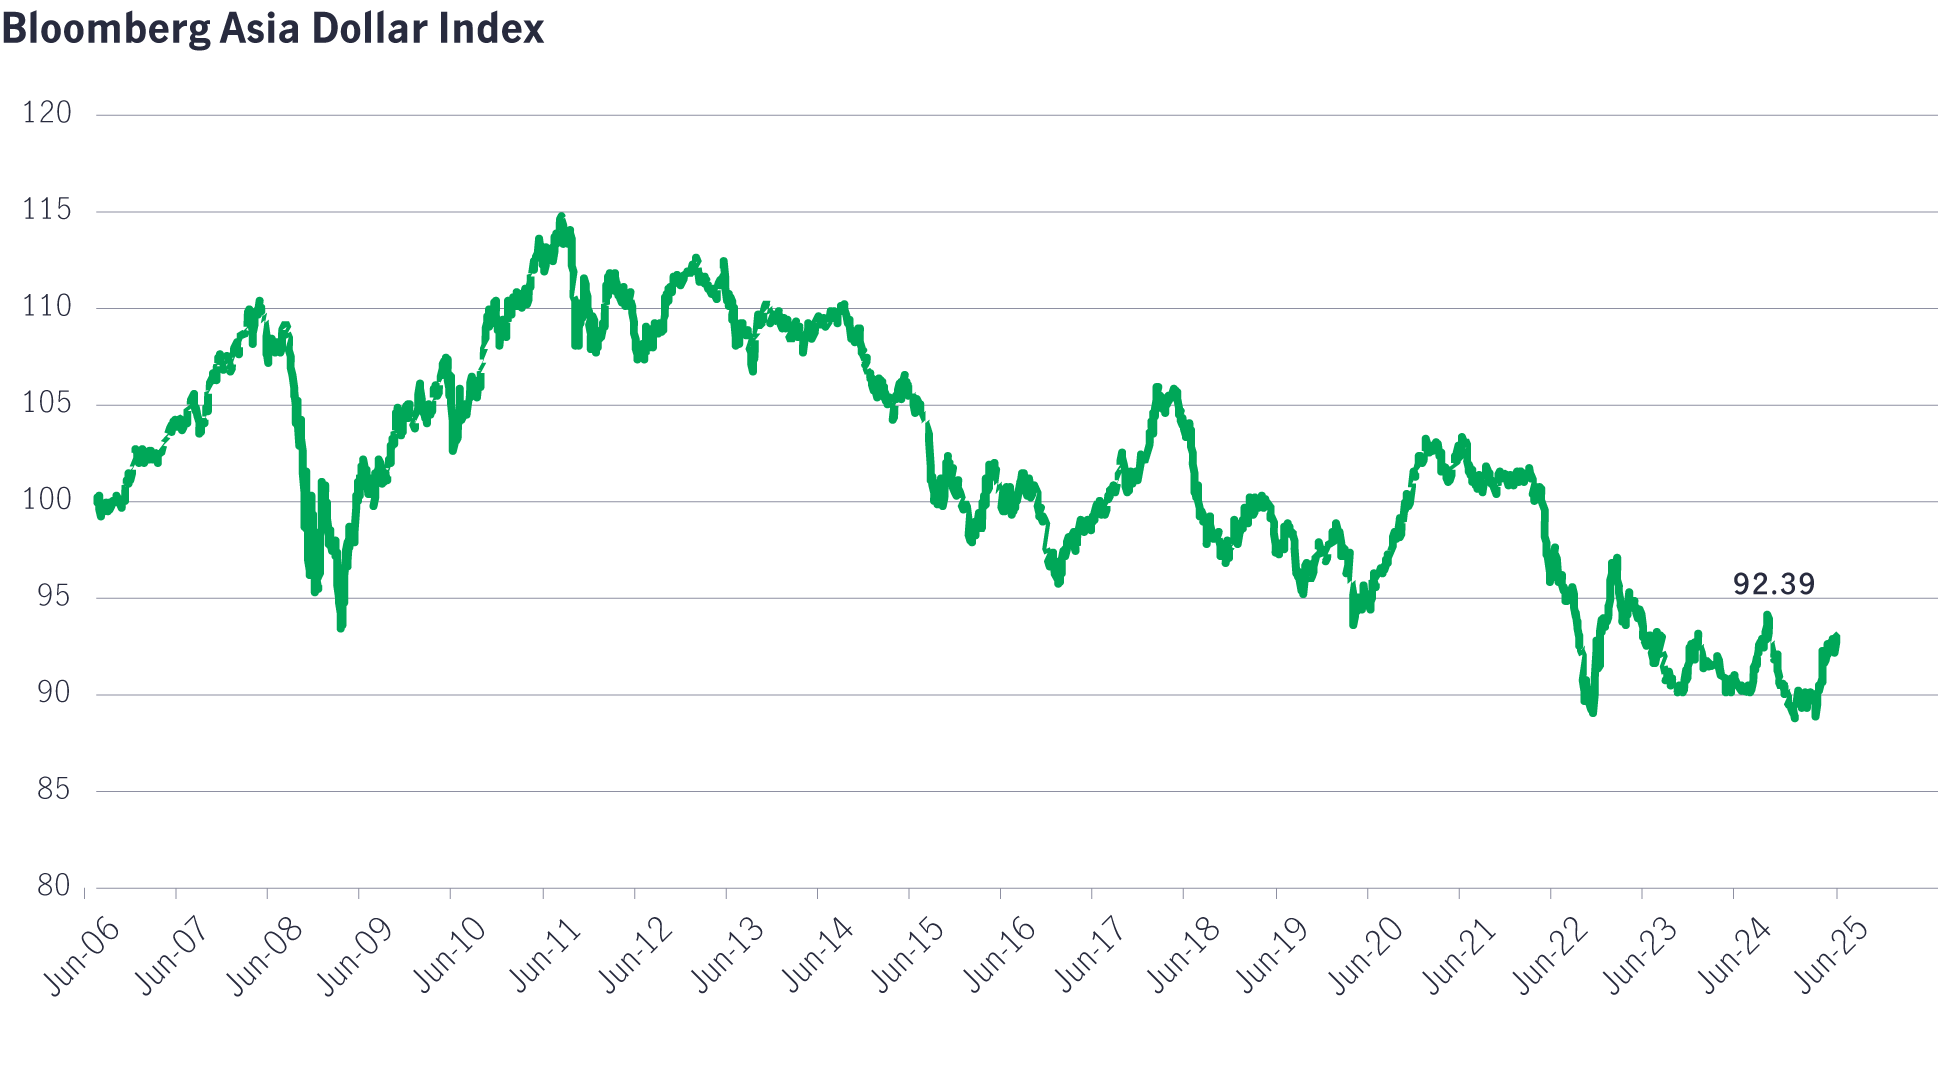
From a valuation standpoint, Asian currencies appear attractive. The Bloomberg Asia Dollar Index has declined from 104 to around 93 over the past decade, suggesting room for appreciation against the US dollar over the medium term (see Chart 4).
Chart 4: Asian currency strength; US dollar weakness4
Asian local currency bonds: Sustaining strong momentum into year-end
Monetary easing and US dollar weakness have been key drivers of Asian local currency bond performance in 2025.
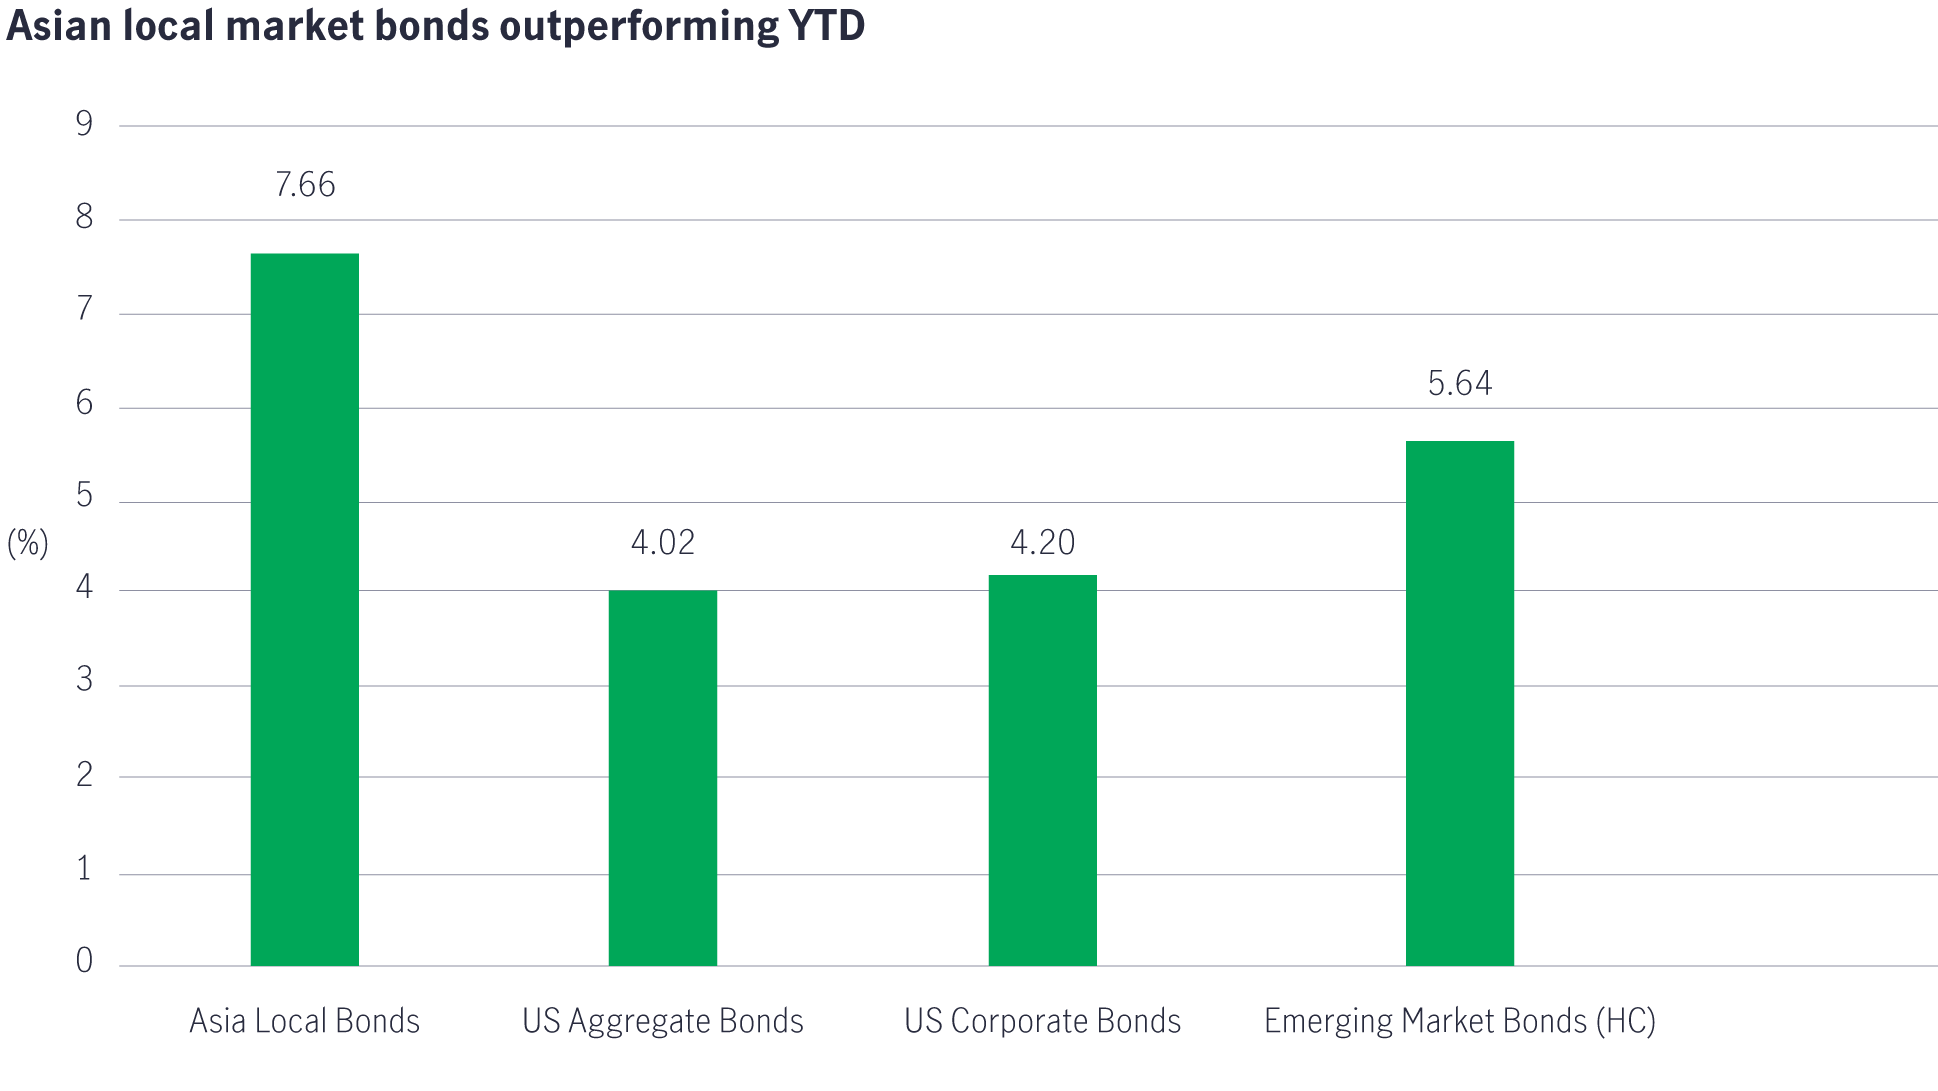
Despite concerns over the potential negative impact of US trade tariffs on the region, Asian local currency bonds have outperformed both US and broader emerging market bonds year-to-date (see Chart 5). This resilience has been underpinned by proactive rate cuts from regional central banks and a broadly weaker US dollar.
Chart 5: Asian local bond and currency outperformance5
We see positive returns for Asian local currency bonds extending into the second half of 2025, though perhaps not as eye-catching as the returns achieved year-to-date. Performance in the second half is expected to be driven primarily by rates rather than currency.
Asian local currency bonds continue to offer attractive yields and diversification benefits for global investors. When managed through a total-return approach—actively navigating interest rate, credit, and currency risks—these bonds can deliver compelling income and risk-adjusted returns over the longer term.
Amid growing uncertainty around US fiscal and trade policies and rising concerns over the risk premium embedded in US Treasuries, we are seeing increased interest in Asian local currency bonds from both global and regional investors.
If this trend continues, it could support sustained demand and further enhance performance across the asset class in the coming years.
Asian dollar credit: Relative value remains compelling
In the hard-currency space, Asian dollar bonds have continued to offer a compelling value proposition. Compared to US and European counterparts, they potentially offer higher all-in yields with lower duration and spread duration—potentially offering a valuable buffer against market volatility in today’s uncertain environment.
A key driver of returns in 2025 has been the higher carry from Asian credit—both in terms of interest income and capital appreciation (“pull-to-par”).
Despite volatility in global interest rates and credit spreads—exacerbated by US policy shifts and Moody’s downgrade of US Treasuries—Asian credits have delivered solid year-to-date returns, supported by stronger fundamentals and a resilient regional economic outlook.
Supportive technicals amid de-dollarisation
The emerging de-dollarisation trend has created a favourable technical backdrop for Asian dollar credit markets. Corporates across the region are increasingly refinancing in local currency markets, where funding costs have become more attractive. This shift has led to a decline in new US dollar bond issuance, tightening supply in the Asian dollar bond market.
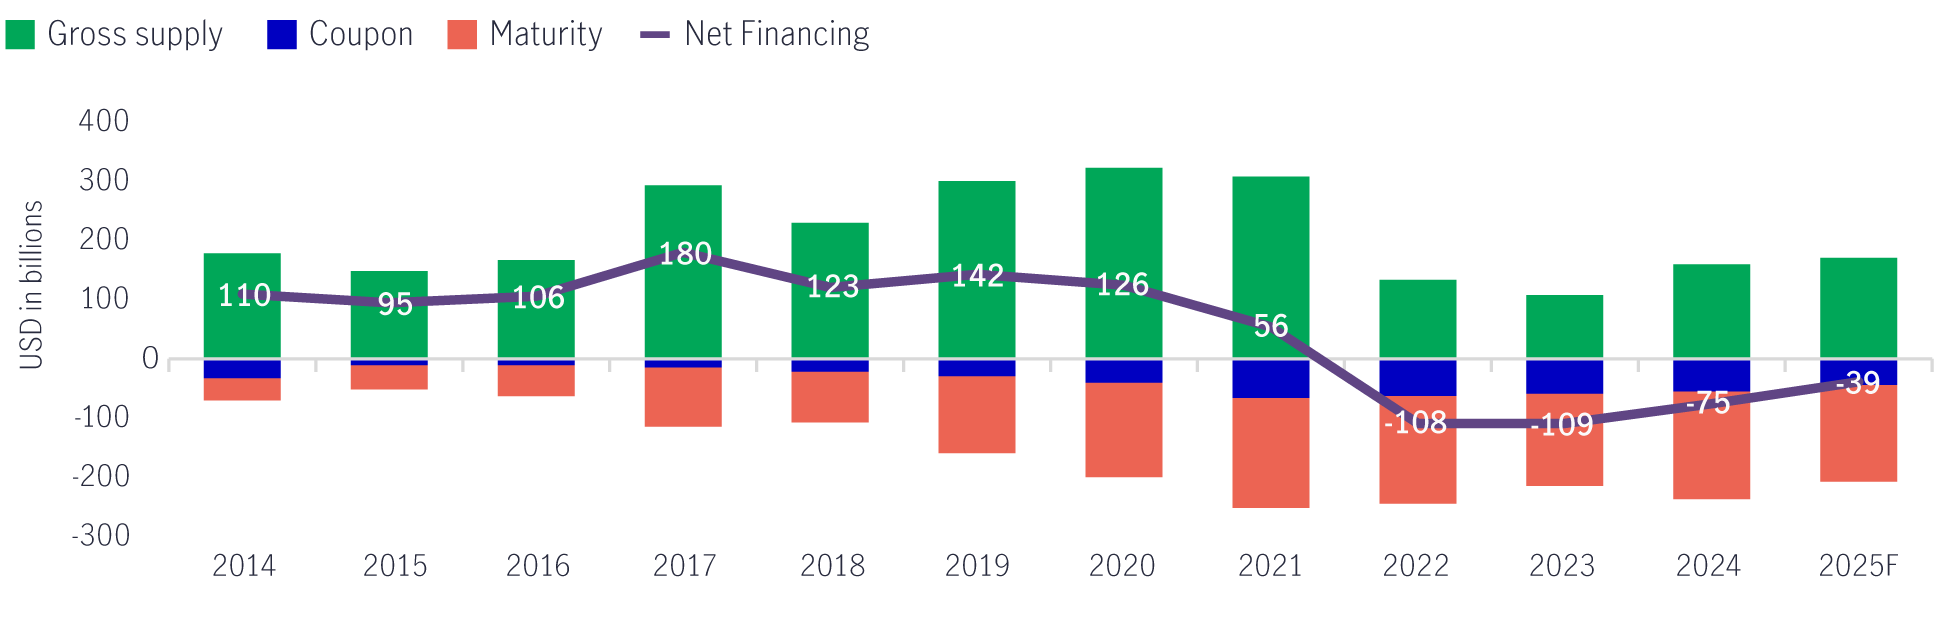
With demand remaining robust and issuance volumes subdued, the supply-demand imbalance has supported price stability and capital appreciation. Looking ahead, if US dollar funding costs remain elevated—as markets currently expect—Asian issuers may continue to favour local currency markets, keeping dollar bond supply constrained in the near term.
Chart 6: Negative net financing expected for fourth straight year6
Conclusion: A strategic opportunity
The first half of 2025 has highlighted growing investor unease around US policy direction, contributing to heightened volatility and a weakening dollar. For strategic investors seeking diversification, the case for investing in Asian fixed income has rarely been stronger, presenting a compelling alternative—both in Asian local currency and credit markets.
Long-term regional fundamentals remain favourable, and the weaker US dollar has provided Asian central banks with room to ease policy further, thereby supporting domestic growth. With solid performance year-to-date and improving investor sentiment, we expect continued inflows into Asian fixed income as global investors, including those based in the region, re-engage with the asset class as a strategic opportunity in the months ahead.
1 Source: Manulife Investment Management, Bloomberg, as of 30 June 2025. Asian Dollar Credit = JACI Composite, US Treasuries = Bloomberg US Treasury Index, Asian Local Currency Bonds = Markit iBoxx ALBI Unhedged. 2 Source: Manulife Investment Management, as of 10 July 2025. 3 Source: Macrobond, Manulife Investment Management, as of 11 June 2025. 4 Source: Bloomberg, as of 19 June 2025. 5 Source: Manulife Investment Management, Bloomberg, J.P. Morgan, as of 30 June 2025. 6 Source: Manulife Investment Management, J.P. Morgan, as of 31 March 2025.
Investing involves risks, including the potential loss of principal. Financial markets are volatile and can fluctuate significantly in response to company, industry, political, regulatory, market, or economic developments. These risks are magnified for investments made in emerging markets. Currency risk is the risk that fluctuations in exchange rates may adversely affect the value of a portfolio’s investments.
The information provided does not take into account the suitability, investment objectives, financial situation, or particular needs of any specific person. You should consider the suitability of any type of investment for your circumstances and, if necessary, seek professional advice.
This material is intended for the exclusive use of recipients in jurisdictions who are allowed to receive the material under their applicable law. The opinions expressed are those of the author(s) and are subject to change without notice. Our investment teams may hold different views and make different investment decisions. These opinions may not necessarily reflect the views of Manulife Investment Management or its affiliates. The information and/or analysis contained in this material has been compiled or arrived at from sources believed to be reliable, but Manulife Investment Management does not make any representation as to their accuracy, correctness, usefulness, or completeness and does not accept liability for any loss arising from the use of the information and/or analysis contained. The information in this material may contain projections or other forward-looking statements regarding future events, targets, management discipline, or other expectations, and is only current as of the date indicated. The information in this document, including statements concerning financial market trends, are based on current market conditions, which will fluctuate and may be superseded by subsequent market events or for other reasons. Manulife Investment Management disclaims any responsibility to update such information.
Neither Manulife Investment Management or its affiliates, nor any of their directors, officers or employees shall assume any liability or responsibility for any direct or indirect loss or damage or any other consequence of any person acting or not acting in reliance on the information contained here. All overviews and commentary are intended to be general in nature and for current interest. While helpful, these overviews are no substitute for professional tax, investment or legal advice. Clients should seek professional advice for their particular situation. Neither Manulife, Manulife Investment Management, nor any of their affiliates or representatives is providing tax, investment or legal advice. This material was prepared solely for informational purposes, does not constitute a recommendation, professional advice, an offer or an invitation by or on behalf of Manulife Investment Management to any person to buy or sell any security or adopt any investment strategy, and is no indication of trading intent in any fund or account managed by Manulife Investment Management. No investment strategy or risk management technique can guarantee returns or eliminate risk in any market environment. Diversification or asset allocation does not guarantee a profit or protect against the risk of loss in any market. Unless otherwise specified, all data is sourced from Manulife Investment Management. Past performance does not guarantee future results.
Manulife Investment Management
Manulife Investment Management is the global wealth and asset management segment of Manulife Financial Corporation. We draw on more than a century of financial stewardship to partner with clients across our institutional, retail, and retirement businesses globally. Our specialist approach to money management includes the highly differentiated strategies of our fixed-income, specialized equity, multi-asset solutions, and private markets teams—along with access to specialized, unaffiliated asset managers from around the world through our multimanager model.
This material has not been reviewed by, is not registered with any securities or other regulatory authority, and may, where appropriate, be distributed by the following Manulife entities in their respective jurisdictions. Additional information about Manulife Investment Management may be found at manulifeim.com/institutional
Australia: : Manulife Investment Management Timberland and Agriculture (Australasia) Pty Ltd, Manulife Investment Management (Hong Kong) Limited. Canada: Manulife Investment Management Limited, Manulife Investment Management Distributors Inc., Manulife Investment Management (North America) Limited, Manulife Investment Management Private Markets (Canada) Corp. Mainland China: Manulife Overseas Investment Fund Management (Shanghai) Limited Company. European Economic Area: Manulife Investment Management (Ireland) Ltd. which is authorised and regulated by the Central Bank of Ireland Hong Kong: Manulife Investment Management (Hong Kong) Limited. Indonesia: PT Manulife Aset Manajemen Indonesia. Japan: Manulife Investment Management (Japan) Limited. Malaysia: Manulife Investment Management (M) Berhad 200801033087 (834424-U) Philippines: Manulife Investment Management and Trust Corporation. Singapore: Manulife Investment Management (Singapore) Pte. Ltd. (Company Registration No. 200709952G) South Korea: Manulife Investment Management (Hong Kong) Limited. Switzerland: Manulife IM (Switzerland) LLC. Taiwan: Manulife Investment Management (Taiwan) Co. Ltd. United Kingdom: Manulife Investment Management (Europe) Ltd. which
is authorised and regulated by the Financial Conduct Authority
United States: John Hancock Investment Management LLC, Manulife Investment Management (US) LLC, Manulife Investment Management Private Markets (US) LLC and Manulife Investment Management Timberland and Agriculture Inc. Vietnam: Manulife Investment Fund Management (Vietnam) Company Limited.
Manulife, Manulife Investment Management, Stylized M Design, and Manulife Investment Management & Stylized M Design are trademarks of The Manufacturers Life Insurance Company and are used by it, and by its affiliates under license.
4694504