Greater China Equities: Pivots, positioning and pace forward
It has been an eventful year for Greater China stock markets, with domestic and global events triggering broad-based weakness and elevated volatility in Mainland China (China), Hong Kong, and Taiwan. In this 2023 outlook, we describe the 3 Ps that set the tone for the new year: pivots, positioning and pace forward.

Greater China equities witnessed widespread weakness during the first three quarters of last year on the back of a hawkish US Federal Reserve (Fed), rising geopolitical tensions, as well as COVID-related lockdowns and other restrictions. Taiwan equities were under pressure, as weak consumer demand for electronic mobile devices led to reduced production and inventory build-up in the technology supply chain. Towards the fourth quarter, China pivoted to supportive measures for the property sector1 and the much-anticipated easing of most COVID restrictions, setting the stage for an impressive rally (see Appendix2).
In the next section, we detail our thoughts for the 2023 outlook based on recent pivots and positioning.
Pivots – Essential moves for an economic turnaround
We believe that policy pivots and resets matter the most for Greater China equities:
1. Easing of COVID restrictions
China reopened its border on 8 January 2023, marking the end of a three-year strict-quarantine requirement. Meanwhile, the Hong Kong-China border also reopened.
With the country no longer pursuing zero-COVID, we see a likely reconnection and revitalisation of economic activity (e.g., investment and consumption). This will be crucial for containing logistical disruptions and global inflationary pressures. In our view, China’s GDP is coming from a low base due to the COVID lockdowns – 2023 GDP is looking to be set at 5% or higher. We also expect the economic recovery to start from the second quarter of 2023 onwards, with corporate earnings bottoming out in the first quarter or first half of this year. Thereafter, we might see healthier fundamentals and upward earnings revisions push the market higher. In the near term, we believe that economic data and fundamentals will remain challenging, and earnings might still face pressure.
2. Central government support for the property sector
In November, the People’s Bank of China (PBoC) and other top regulators jointly announced “three arrows” to provide credit, bond, and equity financing support to China’s onshore property developers (both public and private developers). Furthermore, on 5 January 2023, the PBoC and the China Banking and Insurance Regulatory Commission (CBRIRC) jointly announced that the floor on mortgage rates could be lowered or abolished for first-time house buyers in those cities where new house-sale prices had monthly or yearly decline for three straight months. We expect China’s domestic property sales to recover gradually.
3. Better US-China relations
The Xi-Biden meeting at the G20 summit brought about a better relationship between the world’s two largest economies[1]. Facilitated by China’s re-opening, US Secretary of State Antony Blinken is scheduled to visit China in early 2023. Should China and the US resume more bilateral communications, we expect improvements in the market-risk premium to enhance the return upside in 2023.
Positioning – Reopening plays and secular growth opportunities
China’s reopening derives some bright spots for Greater China equities. We believe the following sectors will benefit from China’s reopening, starting from the first-order and second-order derivatives:
1. Re-opening plays
In the wake of China’s reopening, the service recovery should be significant, especially related to travel services and catering. We should see better growth recovery in online travel agencies (OTAs), considering they are scalable and less constrained by raw-material costs, human-resource challenges, and capacity issues. Furthermore, online/e-commerce, food and beverage, catering, etc., could also recover significantly, enjoying stronger tailwinds from fewer lockdowns.
Despite the pullback in hotel occupancies across China in December 2022 due to the worsening COVID-19 situation, we favour leading hotel-chain operators with earnings upside potential in the early stages of re-opening due to (1) their strong pricing power amid reduced industry supply, (2) operating leverage and (3) better cost structure post COVID-19. Domestic hotel chains are clear beneficiaries of re-opening, and we expect occupancy rates to improve.
Chart 1: China hotel occupancy
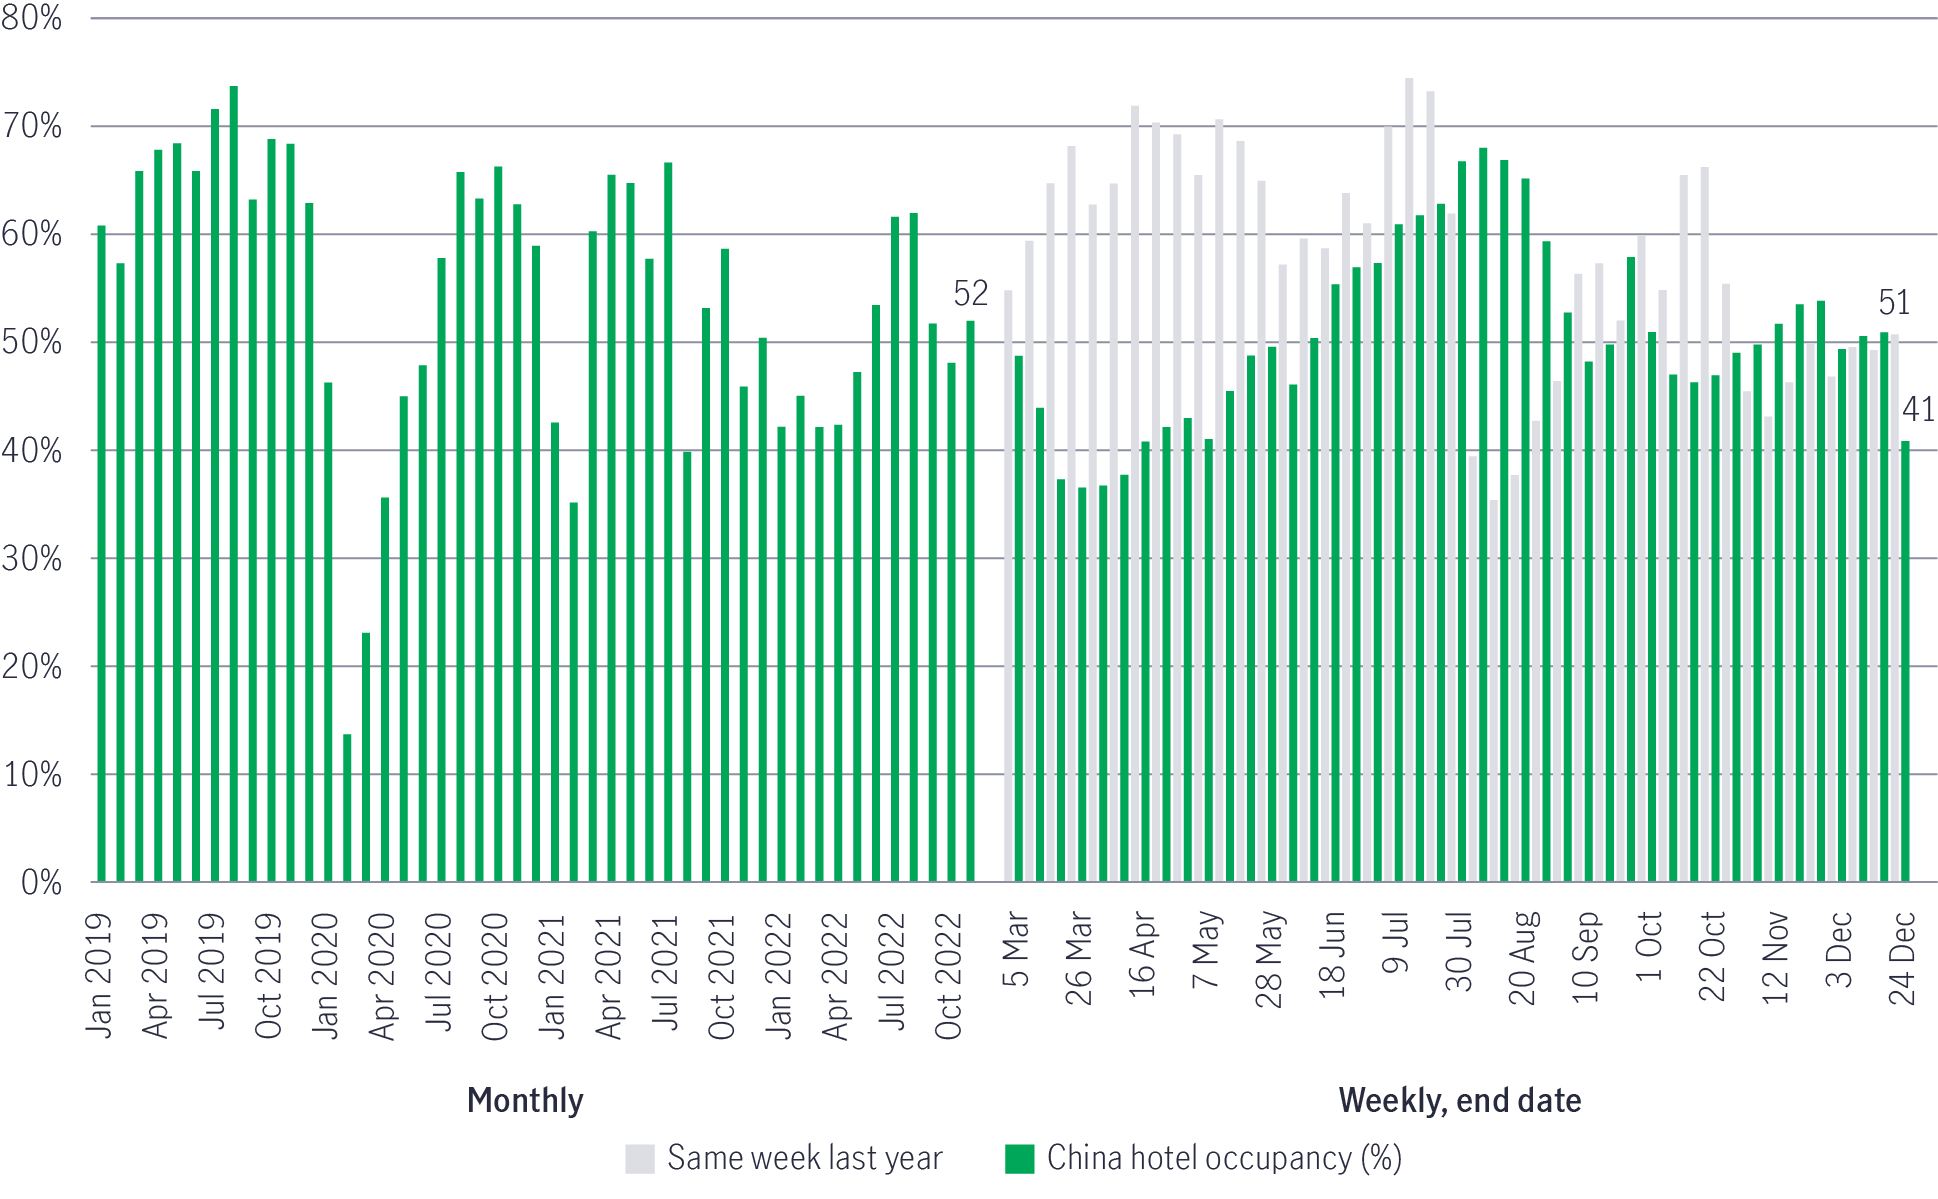
Source: STR, Morgan Stanley Research, as of December 2022.
We favour China internet platform names exposed to niche areas such as recruitment and property solutions that could see stronger rebound after the easing of COVID controls.
The second-order derivatives relate to capital spending. In the past 18 months, capital spending in China has declined due to a lack of growth visibility during COVID-related lockdowns. We foresee corporates to expand capacity in a bid to meet the pent-up demand released by China’s reopening. We see infrastructure investment to lead the recovery cycle, and capital expenditure by private enterprises should gradually pick up upon re-opening. We also see opportunities in construction companies and related materials, as the recent property rescue package targeted the completion of stalled projects.
2. Technology innovation/ localisation and manufacturing upgrade
We see technology innovation and localisation opportunities in China, particularly in the semiconductor and software industries. First of all, electric vehicles (EVs) are the new drivers of the semiconductor industry, as EVs and autonomous driving are boosting demand for chips in cars. Secondly, there are various types of semiconductor products in cars with unique features that could provide significant localisation opportunities in China:
(1) System-on-chip (SoC) – IC that combines the central processing unit (CPU), graphic processing unit (GPU), memory, input/out (I/O) ports and other components on the chip.
(2) Microcontroller unit (MCU) – the most critical part of an electrical control unit (ECU) responsible for infotainment or the powertrain.
(3) Memory – higher density and bandwidth memory semiconductor chips used for autonomous driving, infotainment and network connectivity.
(4) Sensors – high resolution image sensors used in EVs".
We favour Chinese A-share semiconductor component companies, design houses and fabrication equipment suppliers that are value- chain leaders benefiting from industry growth and localisation opportunities.
Chart 2: Key areas for China’s chip makers
EVs to boost the demand for chips
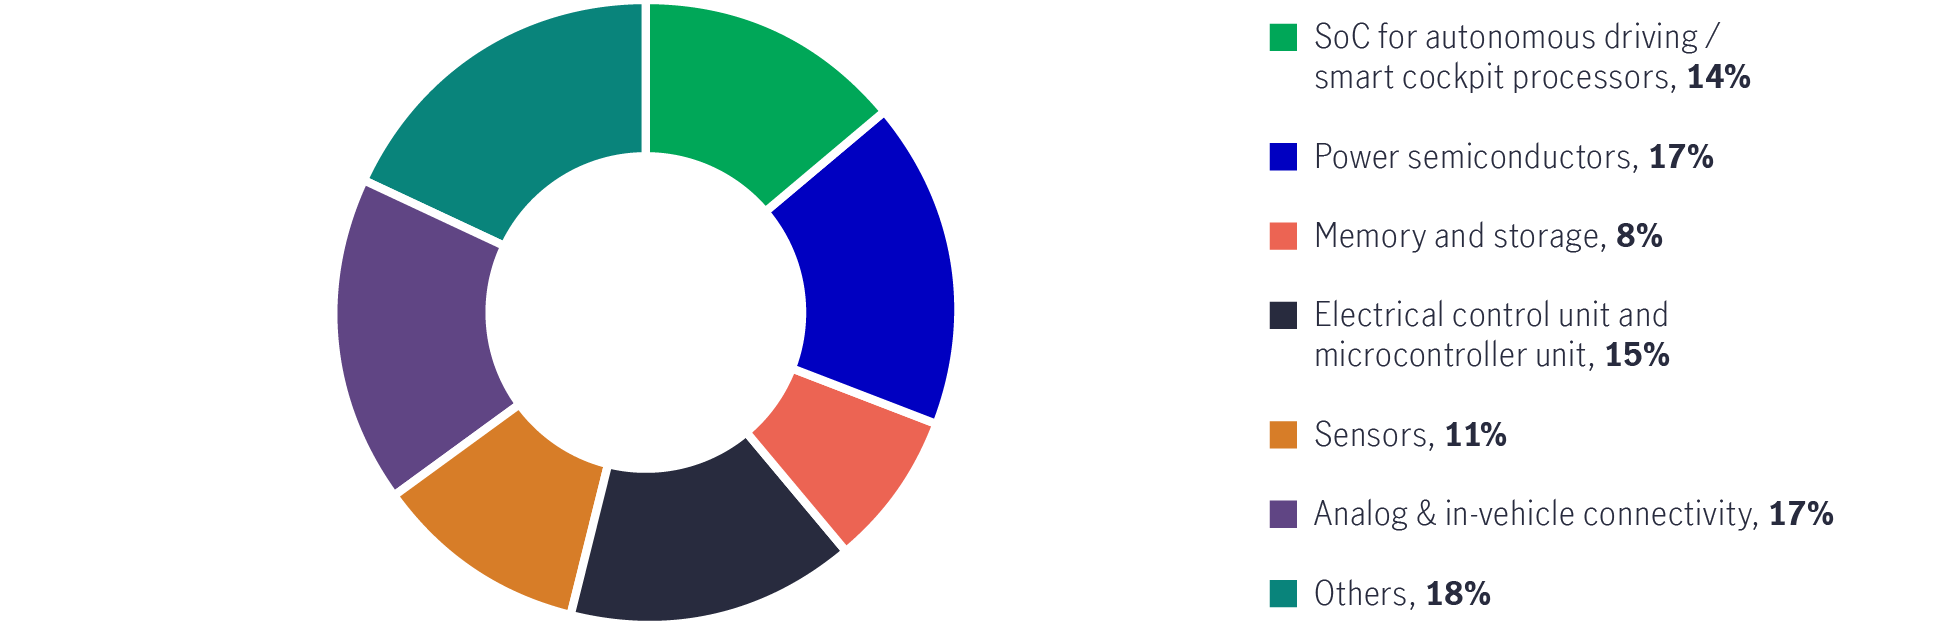
Market size of auto semiconductors
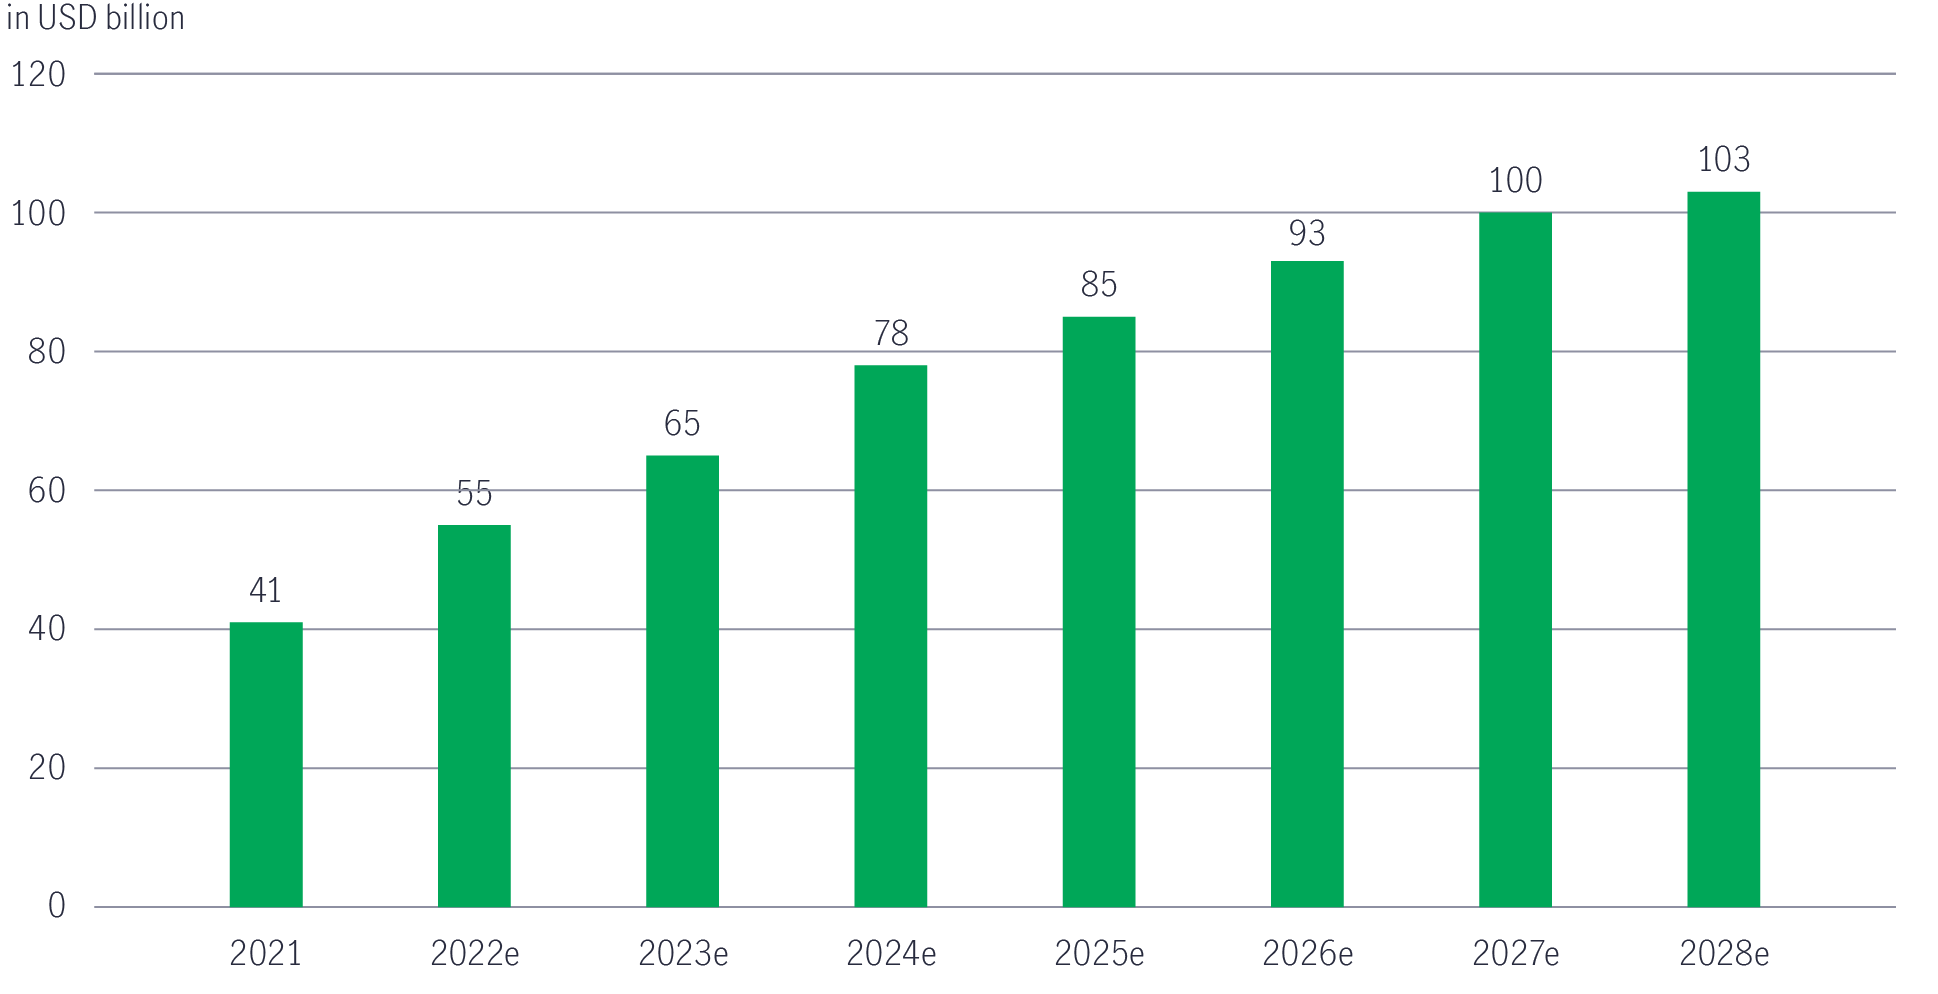
Source: Manulife Investment Management, HSBC Qianhai Securities, as of July 2022. The above information may contain projections or other forward-looking statements regarding future events, targets, management discipline or other expectations. There is no assurance that such events will occur, and the future course may be significantly different from that shown here.
For the equipment market, China registered strong growth of 58% year on year (YoY) to US$29.6 billion in 2021. The localisation rate of China’s chip equipment remained low at around 10%, which presents ample opportunities for domestic companies to grow4.
In terms of software, we favour companies that are key beneficiaries of rising digitalisation across different industry verticals – in particular Software as a Service (SaaS) leaders benefitting from (1) enterprise digitalisation transformation, (2) increased demand from cost savings and (3) operating efficiencies.
According to the Ministry of Industry and Information Technology (MIIT), China’s software industry revenue grew by 9.8% YoY to RMB 6.4 trillion in the first eight months of 2022 despite a COVID-19 resurgence in China. China’s SaaS penetration in terms of total IT spending is still much lower than that of the U.S.5
By segment, IT services and security enjoy faster growth than software products and system software.
On the other hand, China’s enterprise application SaaS market is expected to grow by 22% (2021-26E CAGR) driven by an expansion of the public cloud market and rising penetration due to demand for enterprise digital transformation.
With faster software self-sufficiency amid geo-political tensions, we believe domestic software leaders may also gain market shares from foreign players.
Manufacturing upgrade is another unstoppable trend. Automation is a fast-growing industry in China, riding on the trend of labour replacement owing to: (1) rising wages and labour shortage, (2) rapid expansion of emerging end markets such as consumer electronics, automobiles, batteries, solar/semiconductors and (3) the ongoing trend of domestic substitution which drives industry growth. We favour automation-component companies that are (1) leaders in respective component segment with strong R&D capability and product pipeline, (2) vertical integration capabilities increasing ability to control costs.
The Chinese government has reiterated the importance of innovation, technological development, and manufacturing upgrades to pursue technology self-sufficiency, serving as long-term tailwinds for its advanced manufacturing industries involved in scientific and technological innovation. China will reportedly provide more than RMB 1 trillion over the next five years to subsidise its semiconductor industry6, implying a major step towards its self-sufficiency goal. Besides central government support, the industry has been increasing R&D expenditures7. In our view, increased capital expenditure will expand manufacturing capacities, and advanced manufacturing will play an essential role in localising supply chains for manufacturing import substitutes.
3. Taiwan’s tech sector
After a market correction in 2022, valuations of some of Taiwan’s leading tech names are beginning to look attractive. There are signs that inventory levels in Taiwan’s tech sector are beginning to bottom out (most downstream tech companies in Taiwan cut their inventory levels in the third and fourth quarters of 2022). Taiwanese semiconductor names continue to benefit from deglobalisation (some US companies are asking their supply chains to use chip parts and other components made outside of China). Several bright spots are emerging from the Taiwanese tech sector:
- We favour foundries that would likely benefit from China’s self-sufficiency ambitions after the US expanded its list of chip-export restrictions. Global companies are looking to diversify their factory locations and seeking semiconductors and related parts from China and US, as well as other markets. We expect higher demand for semiconductors as capex spending may begin to pick up in the second half of 2023.
- We also favour Taiwanese tech-component companies in the server industry that are benefiting from new product pipelines.
- We favour display-technology companies riding on demand for electronic shelf label (ESL) adoption.
Pace forward – Stay active on China’s recovery momentum
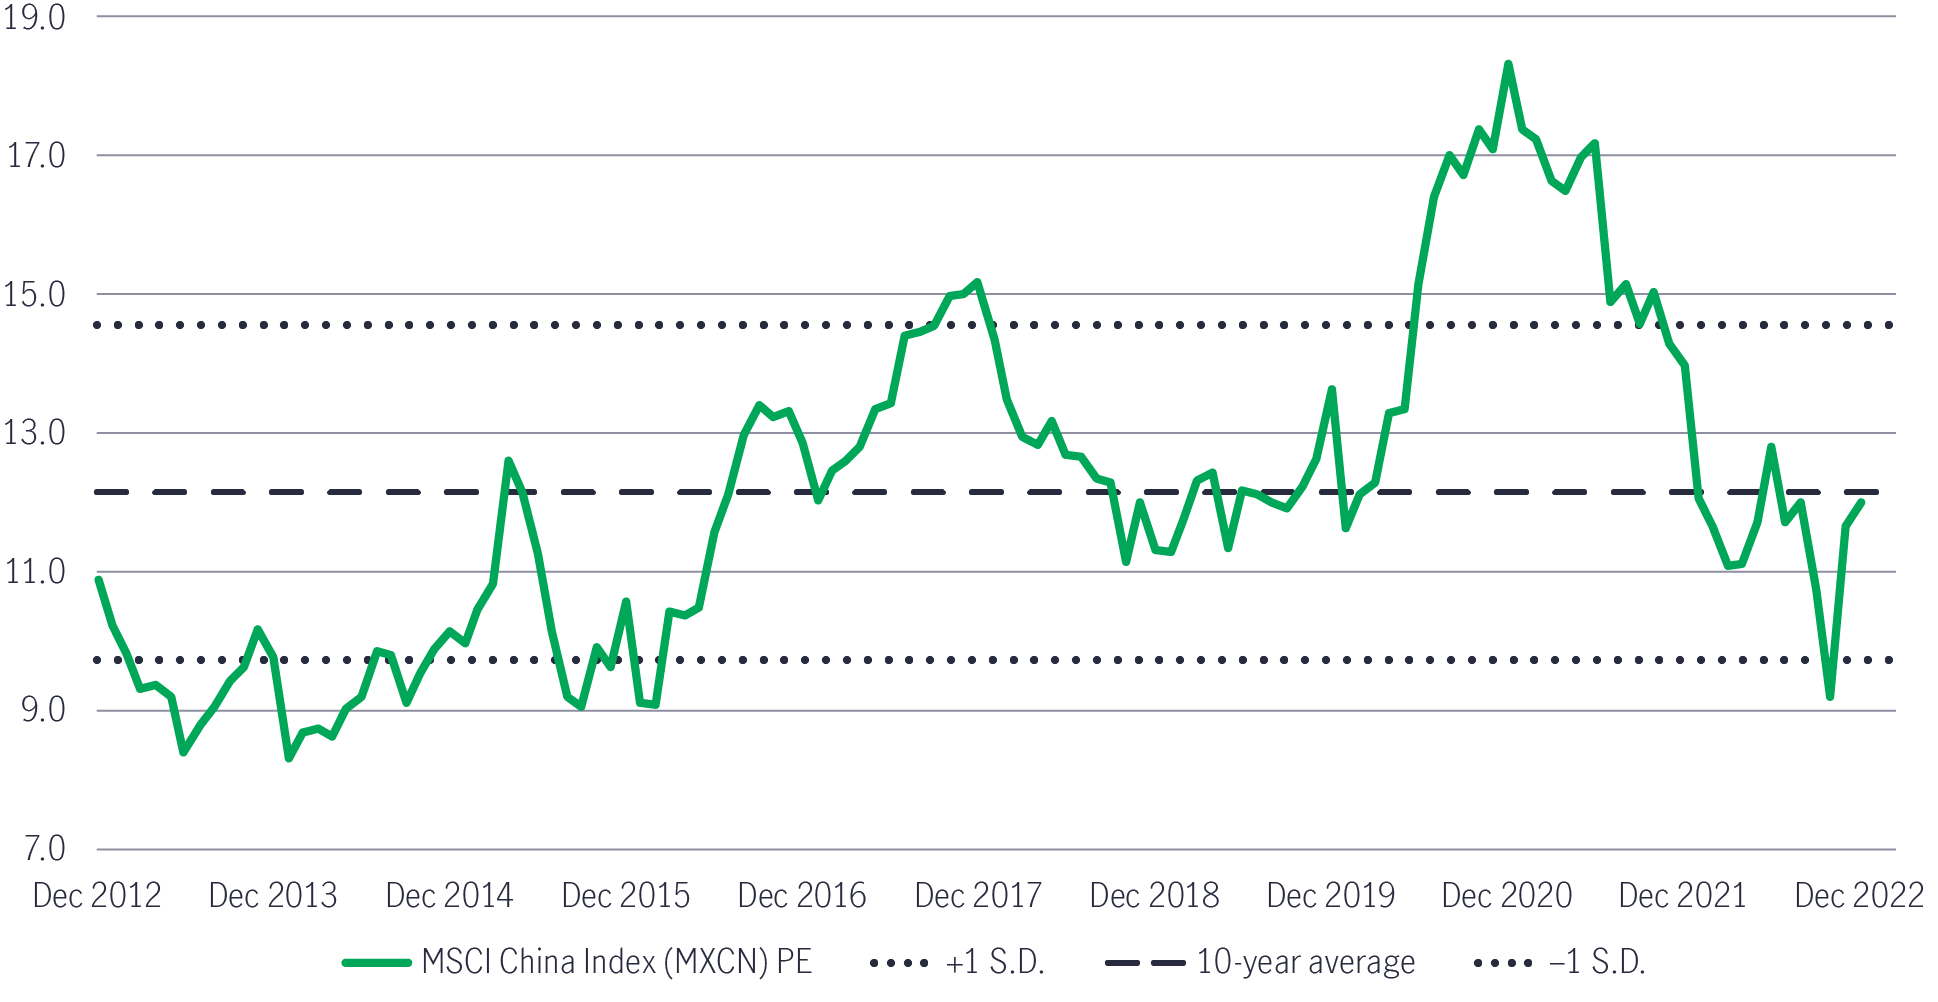
In the past year, the Greater China equity market has been affected by US interest rate rises and China’s macro and COVID-19 policies. The valuation of the broad market, MSCI China Index, now trades at 11.6 times price-to-earnings (PE), close to its 10-year historical average8. Given the Fed rate hikes are expected to slow9, and China’s economic fundamentals should gradually pick up following more reopening measures, we think Hong Kong equities (including H-shares) could see their PE multiples rise, led by the valuation re-rating cycle, with the potential of outperforming A-shares in the first quarter of this year.
Overall, we are optimistic that Greater China equities will enter a more constructive stage. While the near-term global macro-outlook remains challenging, Greater China equities are expected to see healthier fundamentals and a re-rating of valuations on the back of China’s reopening. We are encouraged by the growth opportunities derived from China’s re-opening, technology innovation/localisation, manufacturing upgrade, and Taiwan’s tech sectors.
Appendix
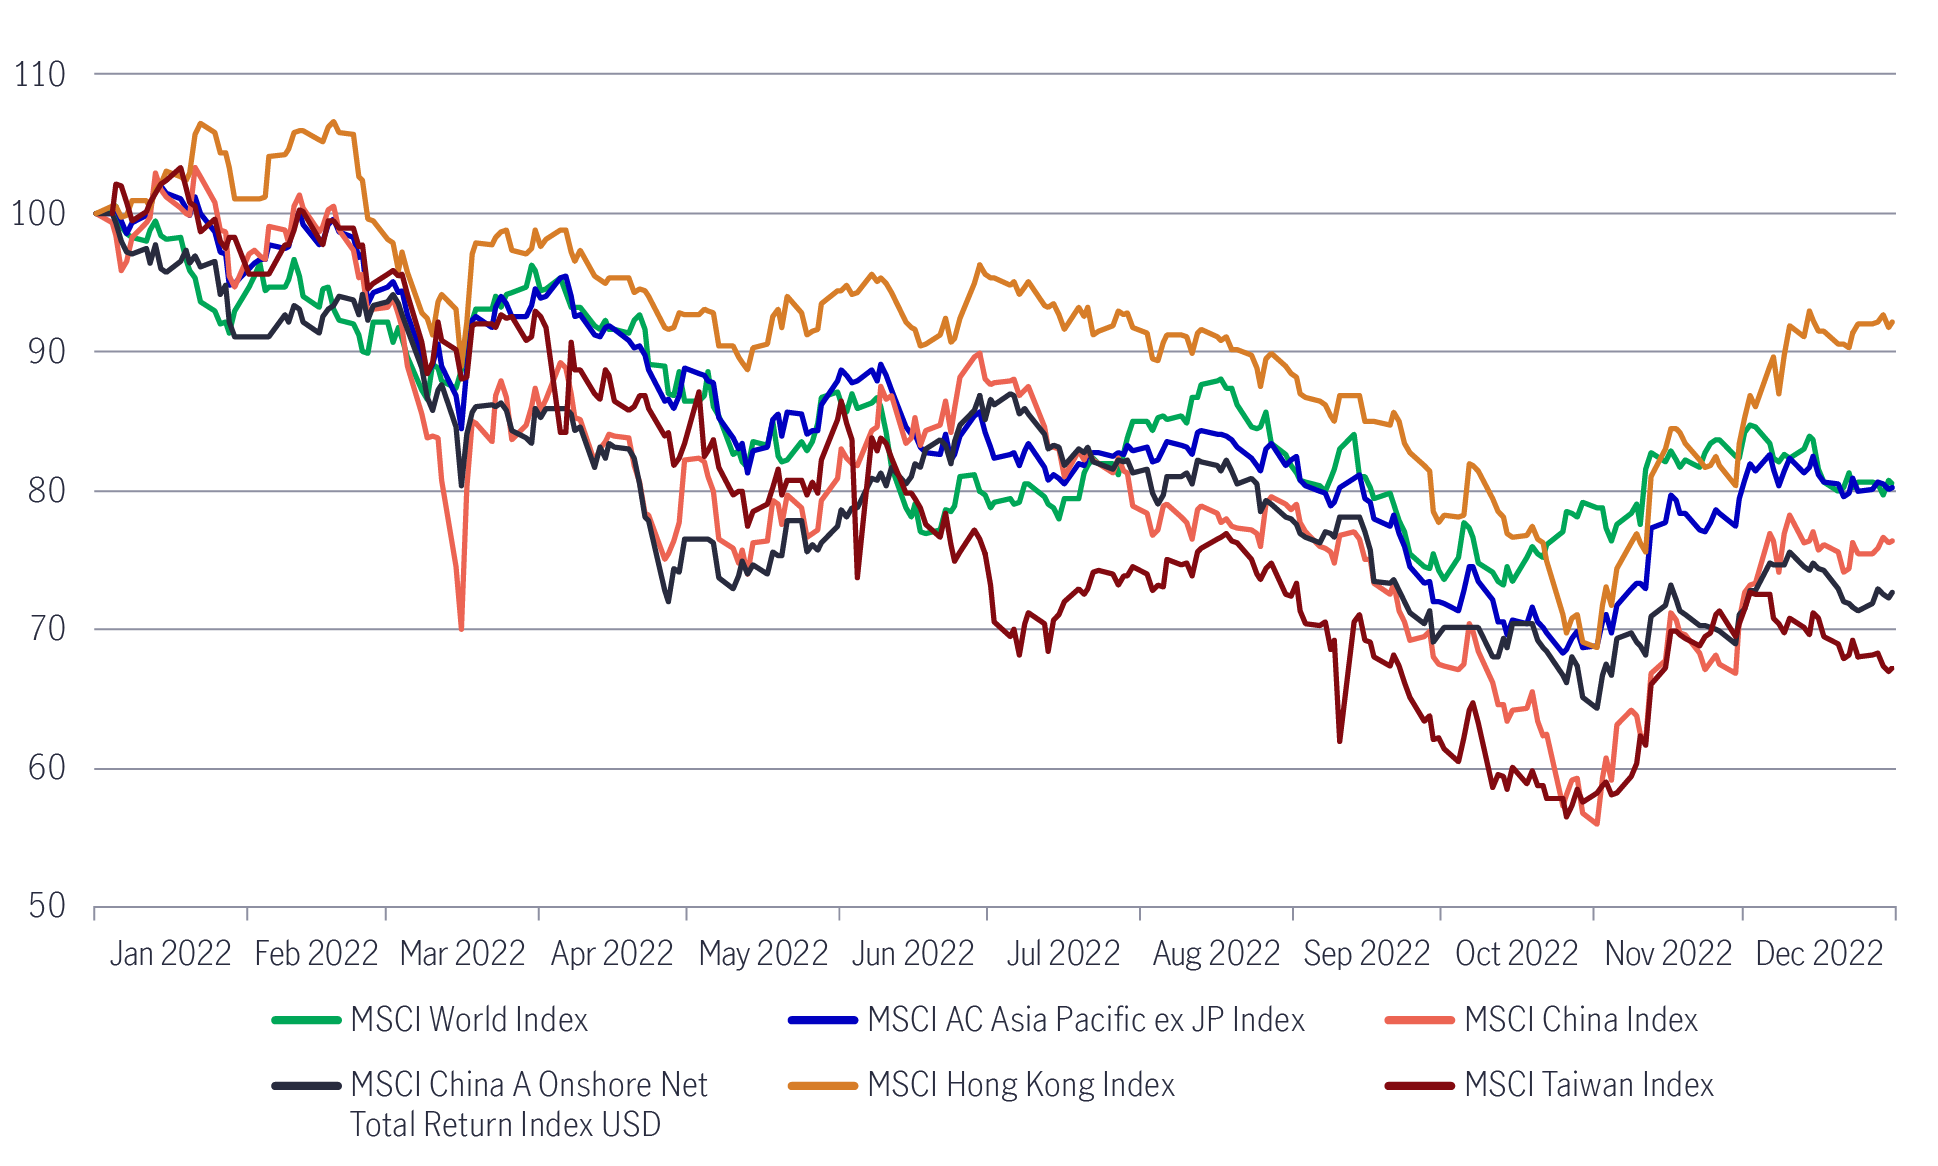
Greater China equity markets 2022 performance2
MSCI China Index (MXCN) valuation as of 31 December 20228
1 The “three arrows” in November 2022– On 8 November, the National Association of Financial Market Institutional Investors (NAFMII) and the PBoC announced a RMB250 billion funding facility to provide support for private corporate-bond financing; On 21 November, the PBoC announced a plan to issue RMB200 billion in interest-free relending loans to commercial banks to help ensure the delivery of unfinished property projects; On 28 November, the China Securities Regulatory Commission (CSRC) announced the optimisation of five measures in equity financing to support the financing of property developers.
2 Bloomberg, Manulife Investment Management, as of 31 December 2022. It is not possible to invest directly in an index. Past performance is not indicative of future performance. All indices are rebased to 100 on 31 December 2021, except MSCI Taiwan which is rebased on 3 January 2022.
3 The Straits Times, 17 November 2022. In November, Chinese President Xi Jinping and US President Joe Biden met at the G20 Leaders’ Summit and pledged to work together to manage tensions and avoid conflict. President Xi added that both sides need to “find the right direction for the bilateral relationship going forward and elevate the relationship".
4 SEMI Equipment Market Data Subscription, July 2021.
5 Gartner, as of 2021.
6 Reuters, 13 December 2022.
7 According to a white paper published by the China Association for Public Companies (CAPCO), listed advanced manufacturers in China reported revenue growth of 20.1% YoY, with R&D expenditures increasing to RMB 642.59 billion in 2021.
8 Bloomberg. Latest PE figure is as of 10 January 2023. Based on Bloomberg’s estimated PE ratio for the next fiscal year.
9 On its 13-14 December FOMC meeting, Fed raised rates by 50bps, decelerating from its 75bps hikes in recent four months. The FOMC’s median projection expects a rate peak of 5.1% in 2023, vs. the current level of 4.25%-4.5%. US November consumer price index (CPI) also indicates easing inflation pressure, with the reading rose 7.1% YoY, lower than expected and being the lowest level since December 2021.
Important disclosures
A widespread health crisis such as a global pandemic could cause substantial market volatility, exchange-trading suspensions and closures, and affect portfolio performance. For example, the novel coronavirus disease (COVID-19) has resulted in significant disruptions to global business activity. The impact of a health crisis and other epidemics and pandemics that may arise in the future, could affect the global economy in ways that cannot necessarily be foreseen at the present time. A health crisis may exacerbate other preexisting political, social, and economic risks. Any such impact could adversely affect the portfolio’s performance, resulting in losses to your investment.
Investing involves risks, including the potential loss of principal. Financial markets are volatile and can fluctuate significantly in response to company, industry, political, regulatory, market, or economic developments. These risks are magnified for investments made in emerging markets. Currency risk is the risk that fluctuations in exchange rates may adversely affect the value of a portfolio’s investments.
The information provided does not take into account the suitability, investment objectives, financial situation, or particular needs of any specific person. You should consider the suitability of any type of investment for your circumstances and, if necessary, seek professional advice.
This material is intended for the exclusive use of recipients in jurisdictions who are allowed to receive the material under their applicable law. The opinions expressed are those of the author(s) and are subject to change without notice. Our investment teams may hold different views and make different investment decisions. These opinions may not necessarily reflect the views of Manulife Investment Management or our affiliates. The information and/or analysis contained in this material has been compiled or arrived at from sources believed to be reliable, but Manulife Investment Management does not make any representation as to their accuracy, correctness, usefulness, or completeness and does not accept liability for any loss arising from the use of the information and/or analysis contained. The information in this material may contain projections or other forward-looking statements regarding future events, targets, management discipline, or other expectations, and is only current as of the date indicated. The information in this document, including statements concerning financial market trends, are based on current market conditions, which will fluctuate and may be superseded by subsequent market events or for other reasons. Manulife Investment Management disclaims any responsibility to update such information.
Neither Manulife Investment Management or our affiliates, nor any directors, officers, or employees, shall assume any liability or responsibility for any direct or indirect loss or damage or any other consequence of any person acting or not acting in reliance on the information contained here. All overviews and commentary are intended to be general in nature and for current interest. While helpful, these overviews are no substitute for professional tax, investment or legal advice. Clients should seek professional advice for their particular situation. Neither Manulife, Manulife Investment Management, nor any affiliates or representatives are providing tax, investment or legal advice. This material was prepared solely for informational purposes, does not constitute a recommendation, professional advice, an offer or an invitation by or on behalf of Manulife Investment Management to any person to buy or sell any security or adopt any investment strategy, and is no indication of trading intent in any fund or account managed by Manulife Investment Management. No investment strategy or risk management technique can guarantee returns or eliminate risk in any market environment. Diversification or asset allocation does not guarantee a profit or protect against the risk of loss in any market. Unless otherwise specified, all data is sourced from Manulife Investment Management. Past performance does not guarantee future results.
Manulife Investment Management
Manulife Investment Management is the global wealth and asset management segment of Manulife Financial Corporation. We draw on more than a century of financial stewardship to partner with clients across our institutional, retail, and retirement businesses globally. Our specialist approach to money management includes the highly differentiated strategies of our fixed-income, specialized equity, multi-asset solutions, and private markets teams—along with access to specialized, unaffiliated asset managers from around the world through our multimanager model.
This material has not been reviewed by, is not registered with any securities or other regulatory authority, and may, where appropriate, be distributed by the following Manulife entities in their respective jurisdictions. Additional information about Manulife Investment Management may be found at manulifeim.com/institutional.
Australia: Manulife Investment Management Timberland and Agriculture (Australasia) Pty Ltd, Manulife Investment Management (Hong Kong) Limited. Brazil: Hancock Asset Management Brasil Ltda. Canada: Manulife Investment Management Limited, Manulife Investment Management Distributors Inc., Manulife Investment Management (North America) Limited, Manulife Investment Management Private Markets (Canada) Corp. Mainland China: Manulife Overseas Investment Fund Management (Shanghai) Limited Company. European Economic Area Manulife Investment Management (Ireland) Ltd. which is authorised and regulated by the Central Bank of Ireland Hong Kong: Manulife Investment Management (Hong Kong) Limited. Indonesia: PT Manulife Aset Manajemen Indonesia. Japan: Manulife Investment Management (Japan) Limited. Malaysia: Manulife Investment Management (M) Berhad 200801033087 (834424-U) Philippines: Manulife Investment Management and Trust Corporation. Singapore: Manulife Investment Management (Singapore) Pte. Ltd. (Company Registration No. 200709952G) South Korea: Manulife Investment Management (Hong Kong) Limited. Switzerland: Manulife IM (Switzerland) LLC. Taiwan: Manulife Investment Management (Taiwan) Co. Ltd. United Kingdom: Manulife Investment Management (Europe) Ltd. which is authorised and regulated by the Financial Conduct Authority United States: John Hancock Investment Management LLC, Manulife Investment Management (US) LLC, Manulife Investment Management Private Markets (US) LLC and Manulife Investment Management Timberland and Agriculture Inc. Vietnam: Manulife Investment Fund Management (Vietnam) Company Limited.
Manulife, Manulife Investment Management, Stylized M Design, and Manulife Investment Management & Stylized M Design are trademarks of The Manufacturers Life Insurance Company and are used by it, and by its affiliates under license.
2671133