A stable rate environment should be a fillip for Asia REITs
Asia Pacific (ex-Japan) REITs (Asia REITs) experienced a challenging 2023 on the back of a restrictive interest rate environment and uncertainty over the timing of a Federal Reserve (Fed) monetary policy pivot. Additionally, high rates across the Asia region led to concerns of significant asset de-valuations. However, a more dovish tone from the Fed, coupled with expectations of potential rate cuts, drove a strong rally in Asia REITs in the fourth quarter. As we outline in this 2024 outlook, Asia REITs offer investors a unique income opportunity in the new year as rates have likely peaked with the possibility of declining borrowing costs in 2024.

2023 was another volatile year for Asia REITs. Performance challenges were apparent for most of the period due to the high interest-rate environment, uncertainty around borrowing costs vis-à-vis the Fed’s rate-hike profile, and the negative implications for REIT distributions, asset values, and growth opportunities. However, Asia REITs rebounded strongly in November and December 2023 as global 10-year benchmark yields declined in response to the Fed’s dovish tone (See Charts 11 and 2). This led to market expectations for potential rate cuts in 2024.
Chart 1: Asia REIT geographic performance, 2023 and November/December 2023
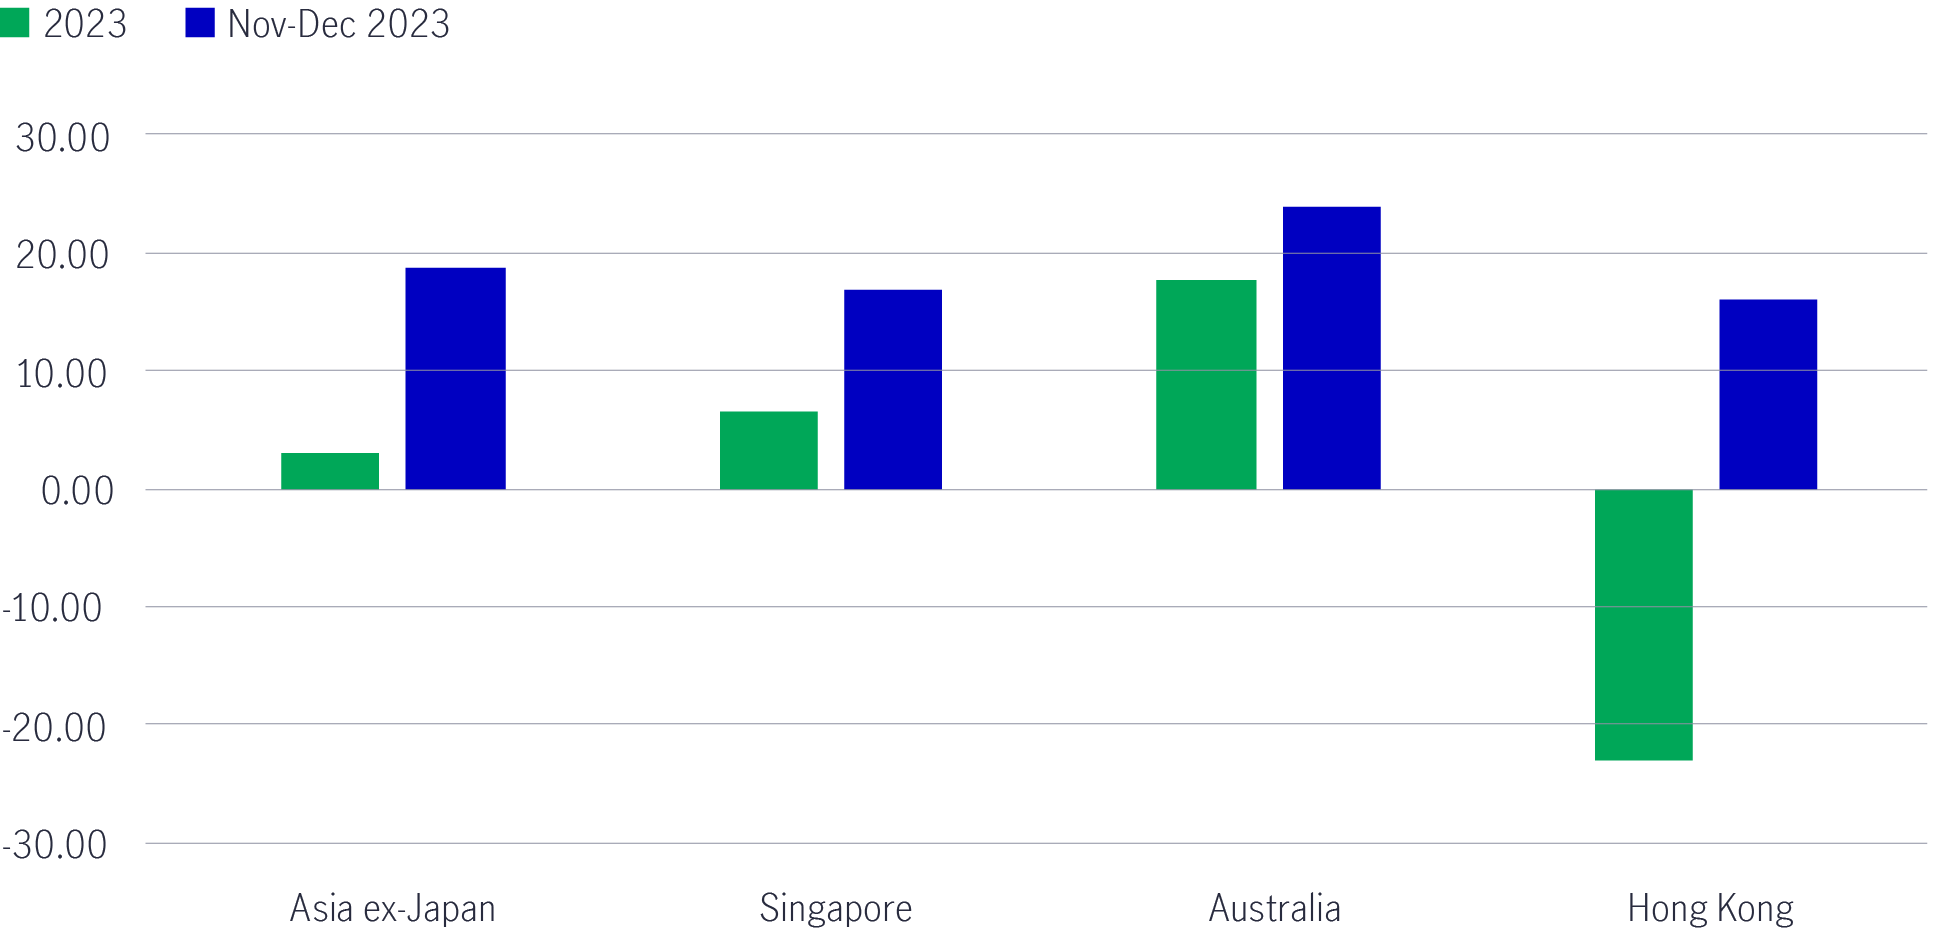
Source: Bloomberg, as of 31 December 2023. Asia ex Japan- S&P Pan Asia Ex-JP, AU, NZ, PK REIT 10% Capped Index (USD) TR; Australia- S&P/ASX 200 A-REIT Index; Hong Kong- Hang Seng REIT Index; Singapore- FTSE ST All-Share Real Estate Investment Trusts Index SGD.
Chart 2: Asia REIT sector performance, 2023 and November/December 20232

Source: FactSet, Manulife Investment Management, as of 31 December 2023. Index: S&P Pan Asia Ex-JP, AU, NZ, PK REIT 10% Capped Index (USD) TR.
Overall, Australia REITs were clear beneficiaries of the changing interest-rate narrative, given they are the most sensitive to US rate moves. In contrast, Hong Kong’s underperformance was more idiosyncratic due to concerns about the impact of China’s economic slowdown on Hong Kong’s reopening optimism.
Despite the persistent macro headwinds negatively impacting Asia REITs, the market’s underlying operational fundamentals remained resilient throughout the year. Positive rental reversions, high occupancy rates, and recovering demand were common drivers across most sectors, which helped mitigate some of the negative impacts on distribution and asset valuations that the market was pricing in.
Considering the potential lower rate environment, we believe that overall financial strength and resilient operational metrics should provide a base for growth momentum to improve once the interest-cost drag peaks in 2024.
Key swap rates moved lower at the end of 2023 (See Chart 3), which indicates declining marginal debt cost for Asia REITs.
Chart 3: Three-year swap rates in selected markets
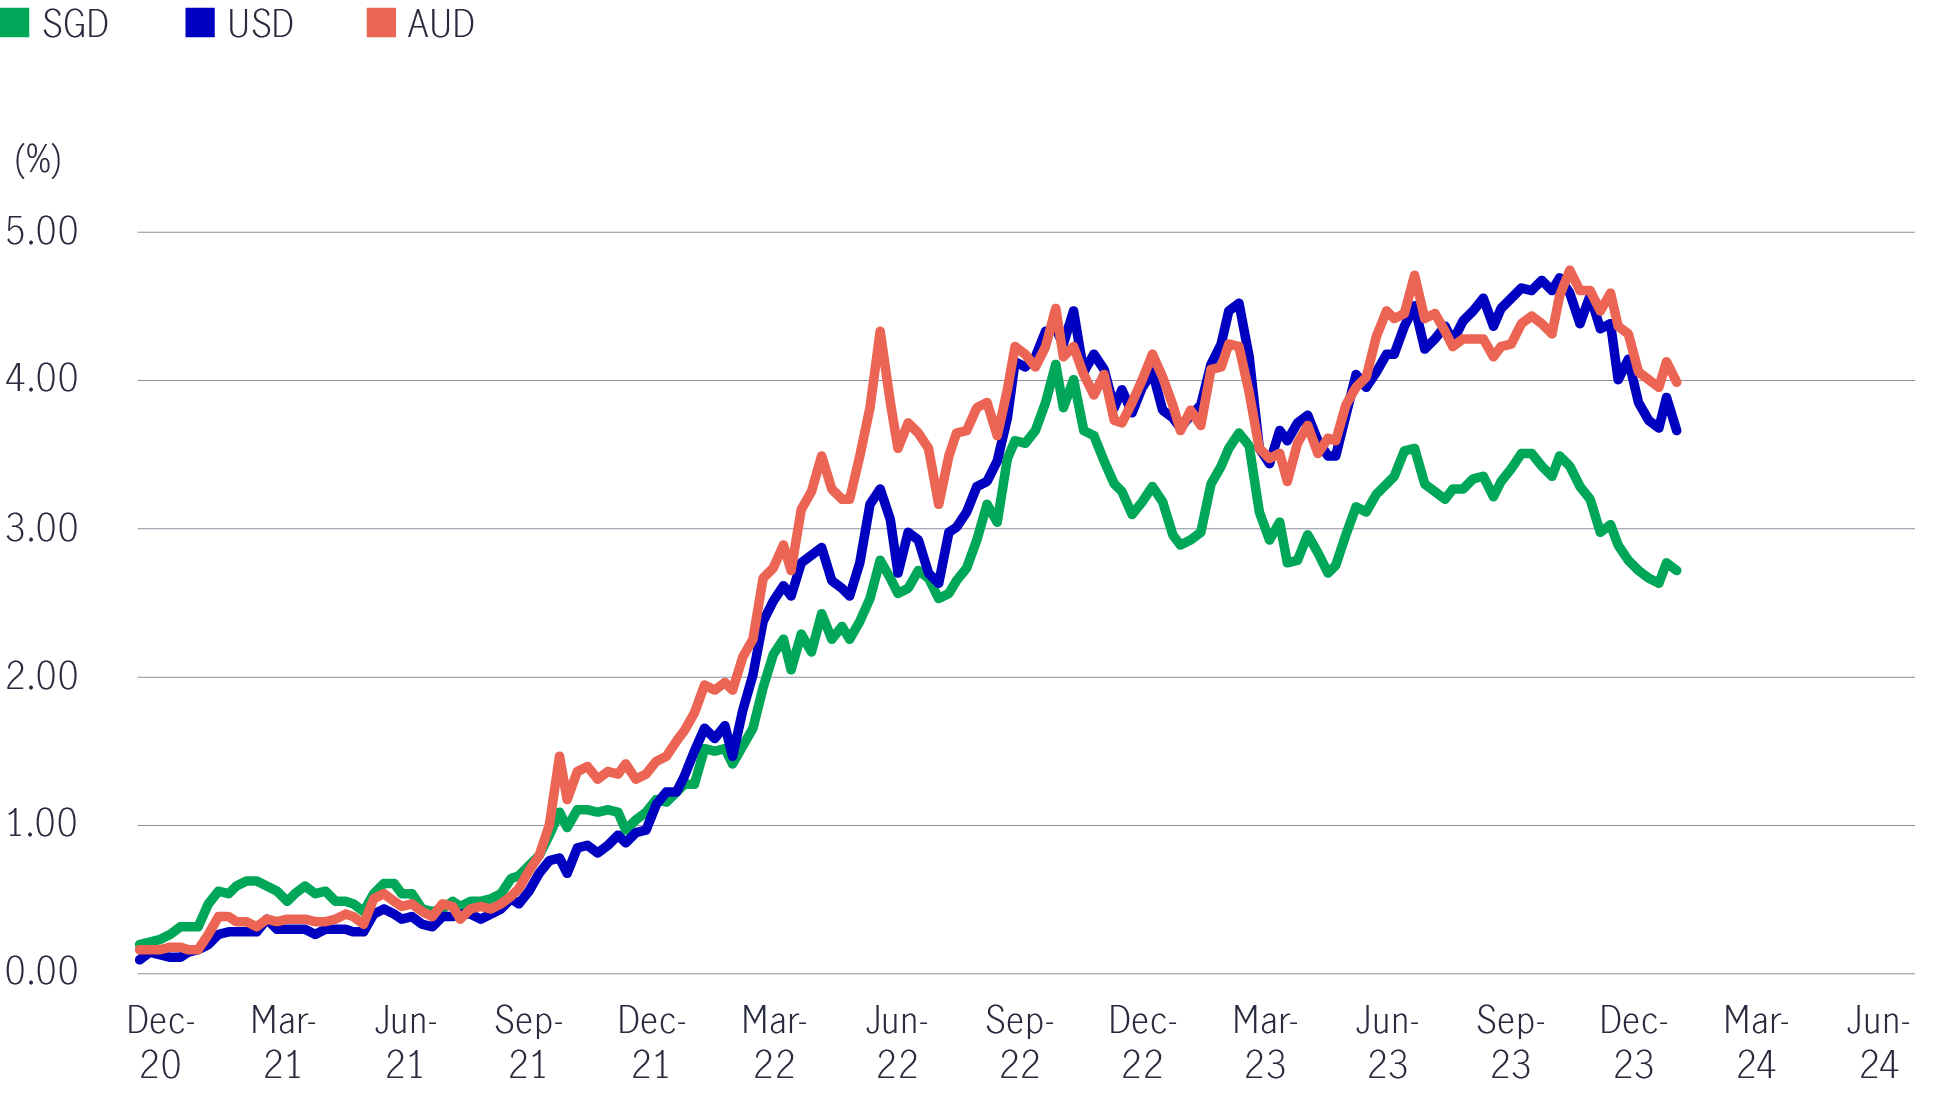
Source: Bloomberg, January 2024.
Today, the borrowing costs for new capital are lower than just three months ago. REITs will need to refinance their debt, and we expect that the cost of debt will peak soon.
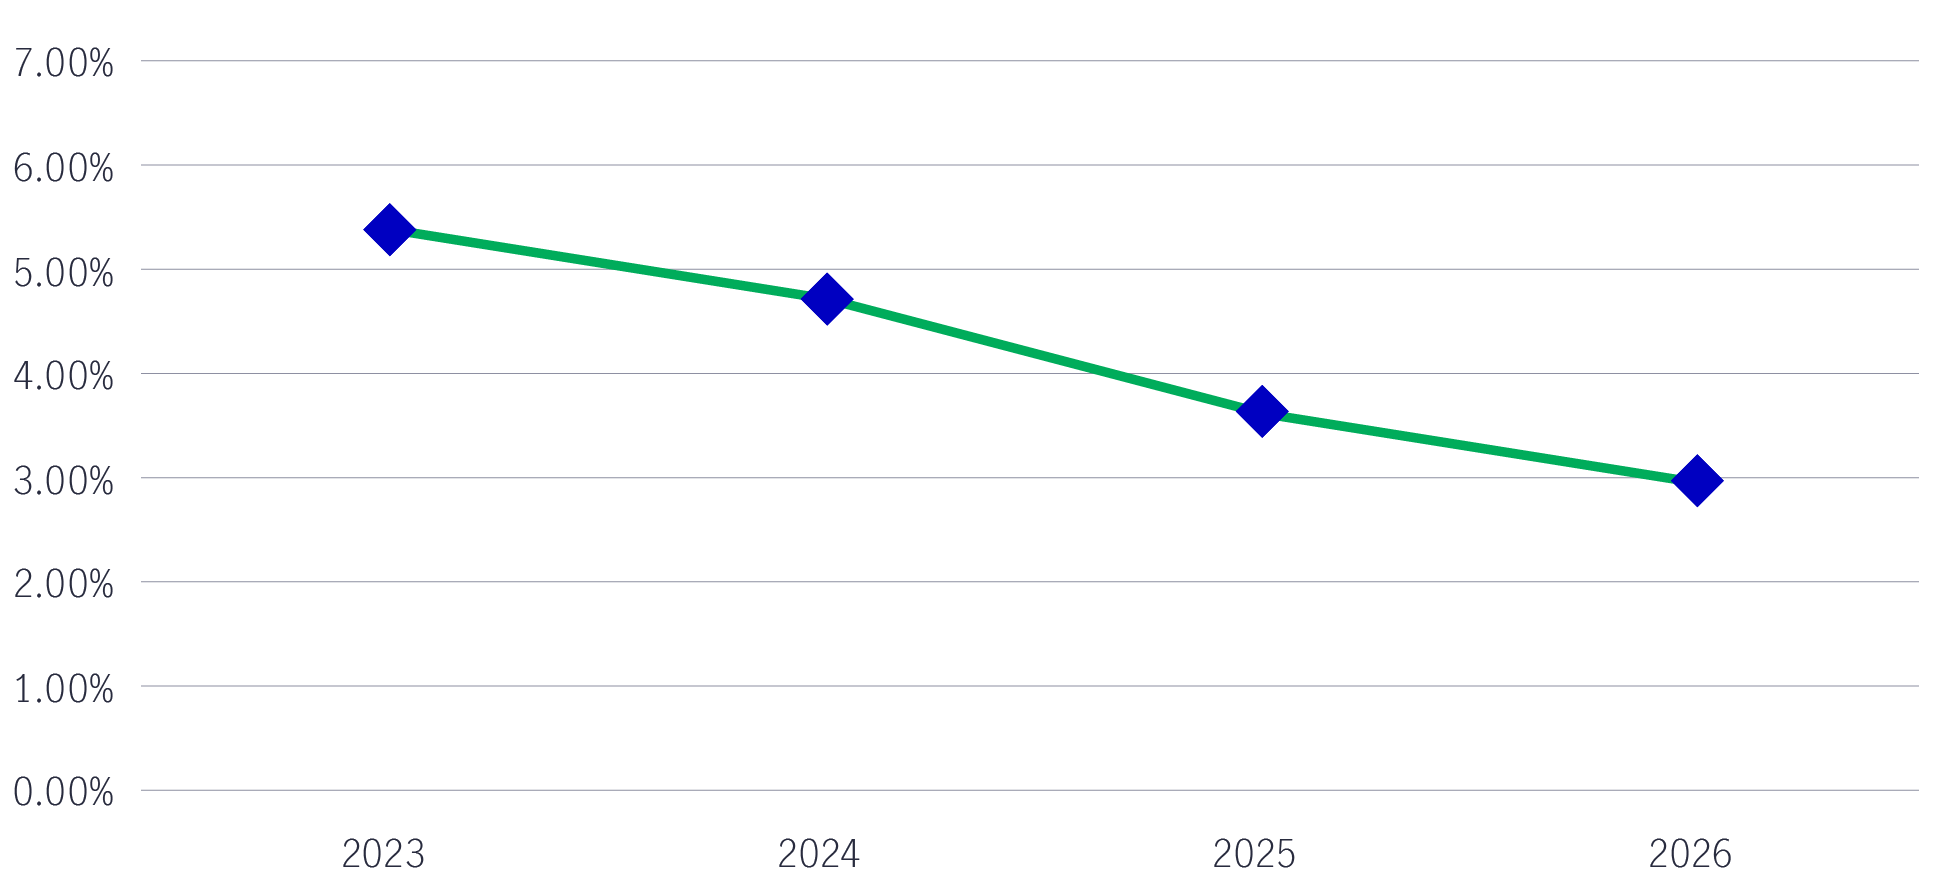
For 2024, the distribution per unit (DPU) outlook is muted. For instance, 25% of Singapore REIT debt will need to be refinanced (at still elevated rates) by the end of the year (See Chart 4). However, visibility has improved as lower rates in the second half of 2024 should allow for dividend growth to resume in 2025.
Chart 4: Debt expiry profile for Singapore REITs

Source: DBS Bank, January 2024.
Meanwhile, in Australia, interest coverage ratios for most of the REIT sector are quite healthy and above the typical covenant levels (see Chart 5). As debt cost headwinds are subsiding, this could potentially relieve pressure on downward earnings revisions for FY 2025 (estimated).
Chart 5: Interest coverage ratio (FY25) for selected Australian REITs
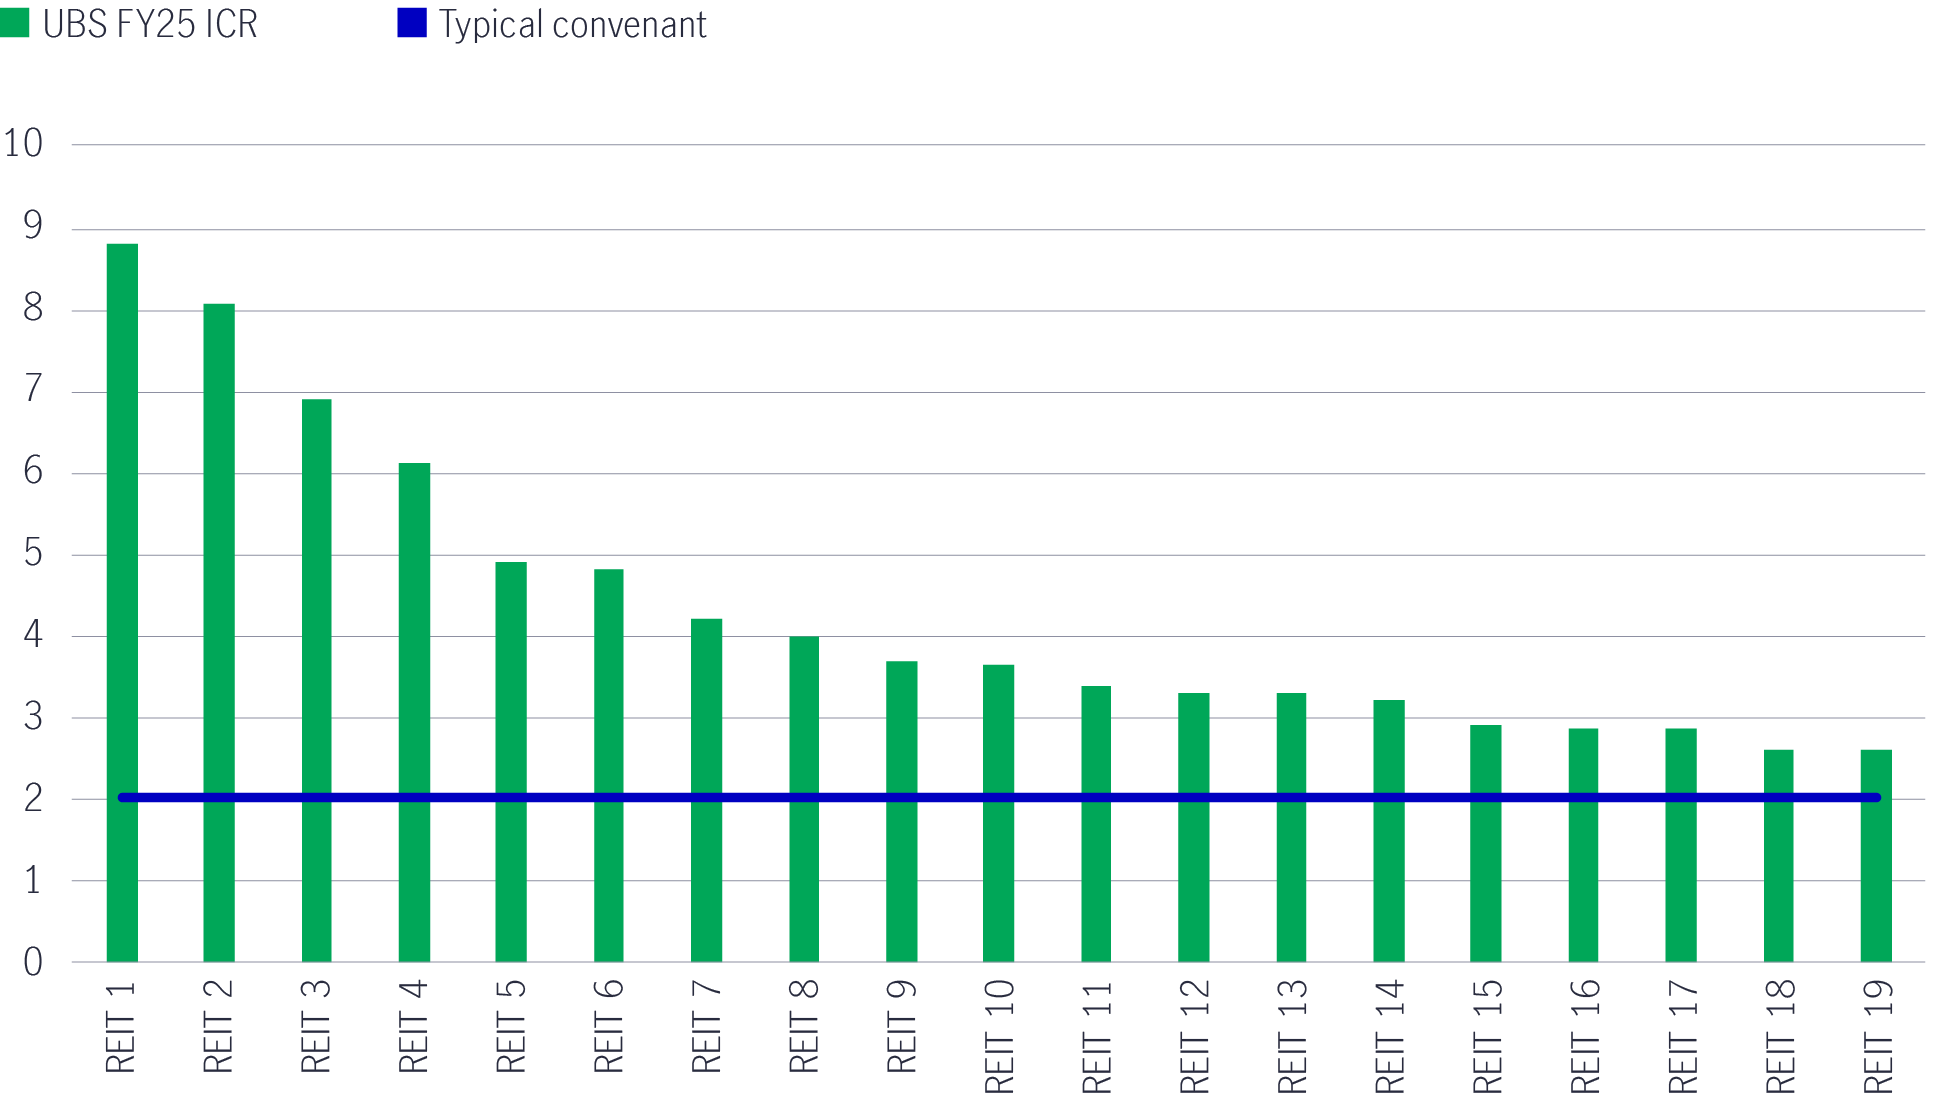
Source: UBS, January 2024.
Despite the most recent rally, REIT yields are still attractive relative to other asset classes (See Chart 6).
Chart 6: Regional REIT yields still attractive among similar investments3
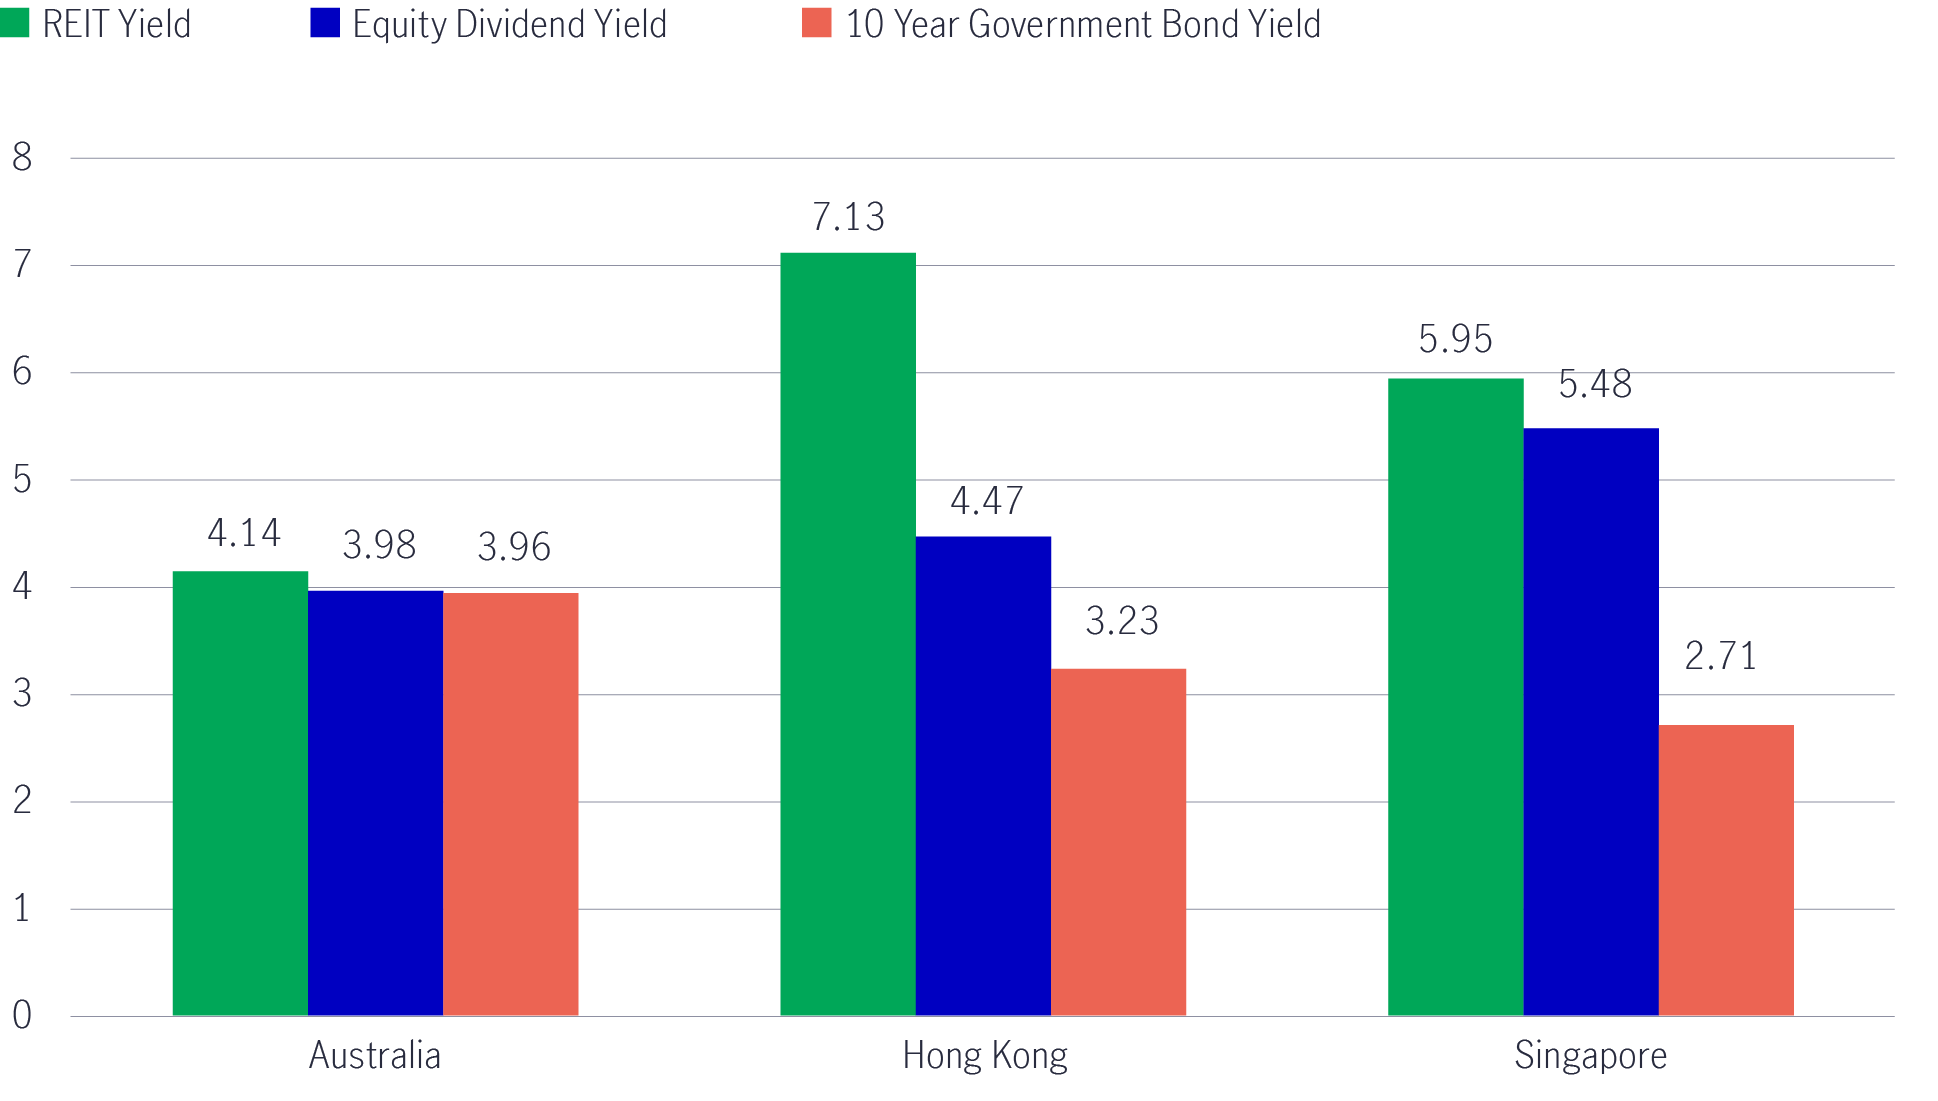
Source: Bloomberg, as of 31 December 2023.
Operational fundamentals are expected to remain resilient – an area of focus in 2024
As the macro headwinds of 2023 are expected to ease in 2024, we believe that the market (and investors) will begin to focus on the underlying fundamentals of REITs. Most Asia REITs have demonstrated resilient operating fundamentals, which we expect to continue in 2024.
This will be underpinned by recovering retail tenant sales amid limited new retail supply, regional supply chain shifts, and/or relatively tight supply, improving spot rentals for suburban retail, data centres and logistics. Furthermore, as leases signed at depressed rental rates during the height of COVID are renewed (particularly in retail), we see sustained healthy rental reversions.
In Singapore and Hong Kong retail, we have seen a decline in the overall occupancy costs for tenants (See Chart 7 and 8). The lower the occupancy costs, the more room landlords have to raise rents. This should be one of the contributing factors to positive rental reversions for the retail sector in 2024.
Charts 7 and 8: Occupancy costs generally falling among Singapore retail REITs and across sectors4
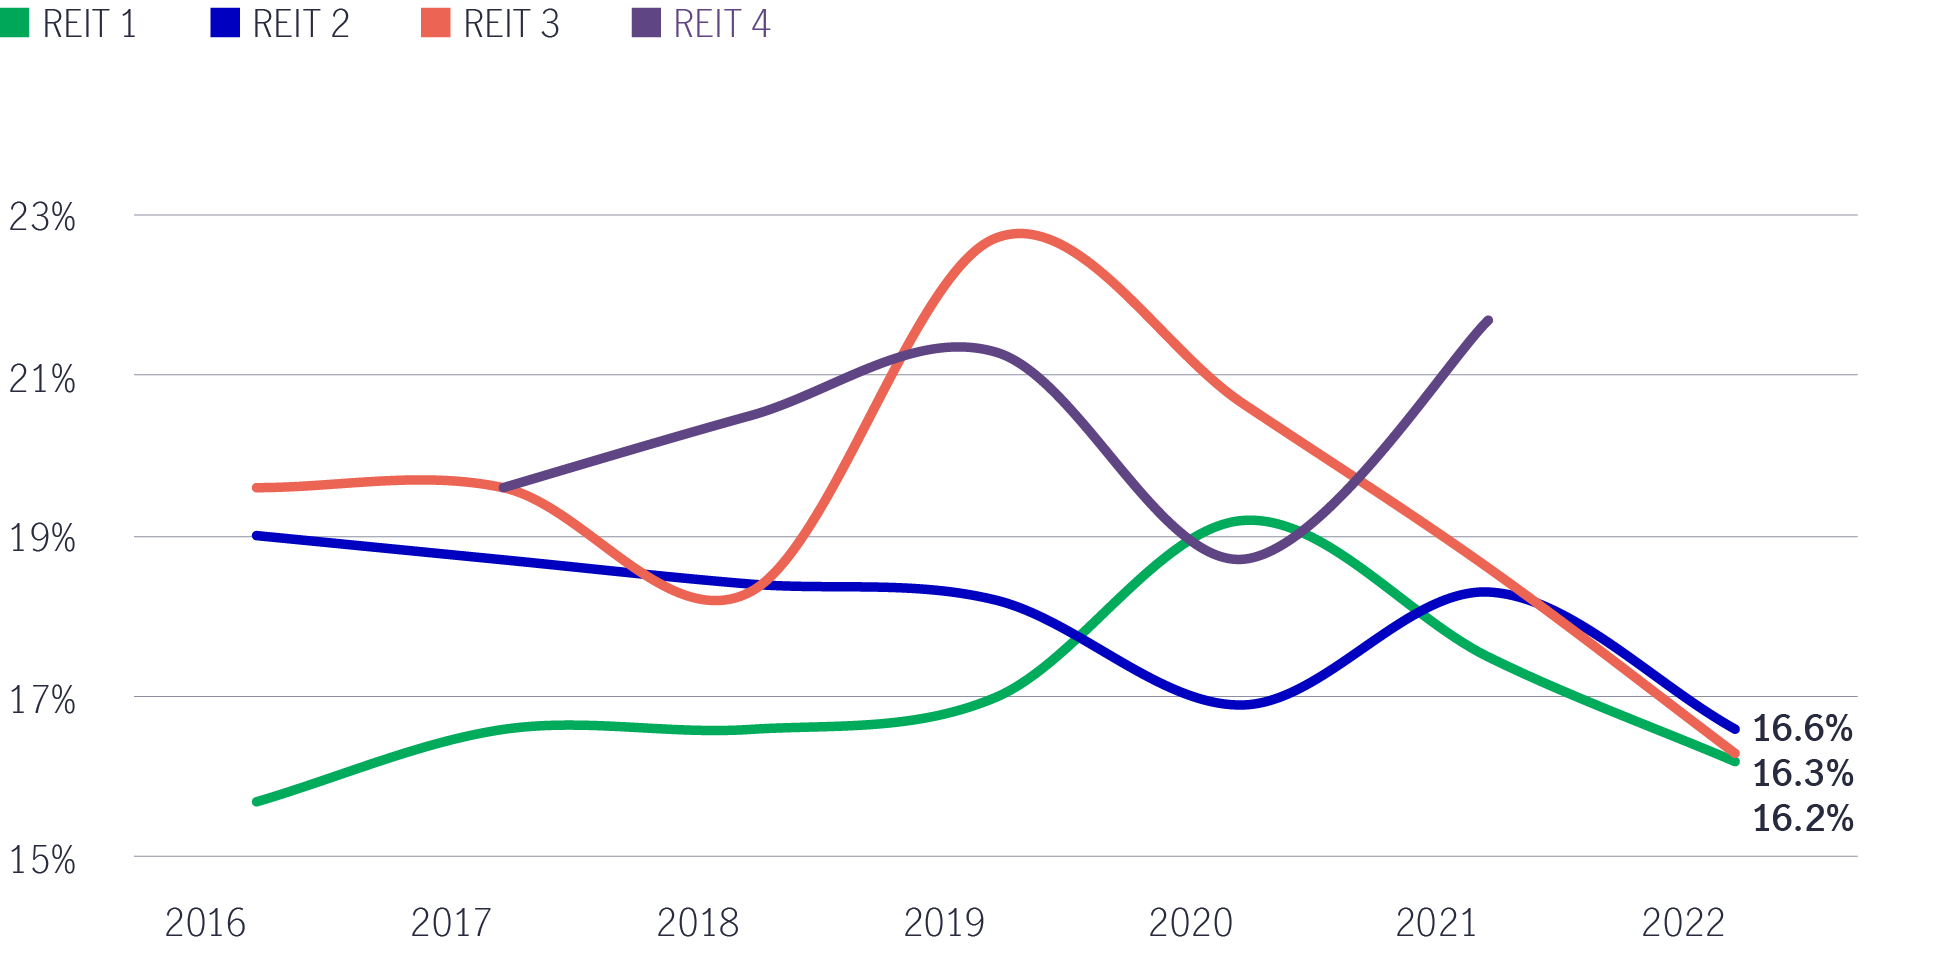
Source: Company reports, DBS Bank, January 2024.
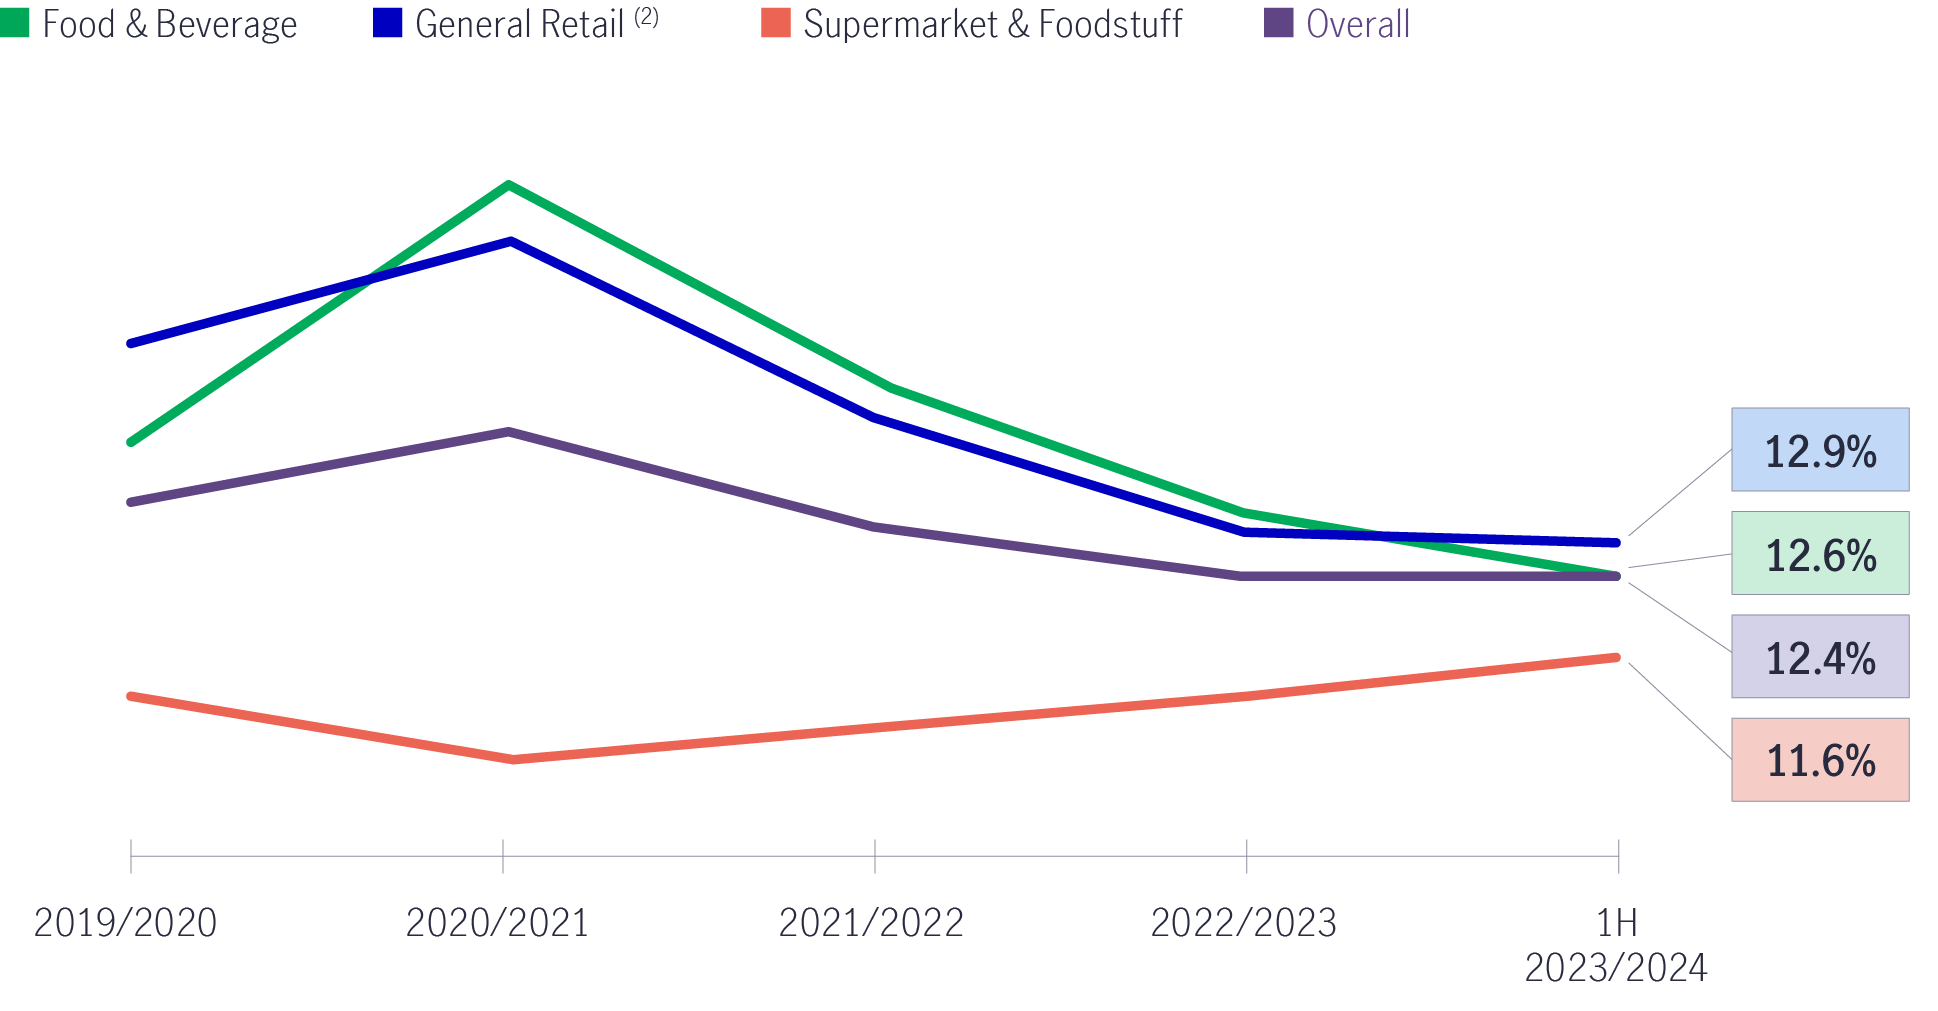
Source: Company reports, November 2023.
Industrial REITS forecast to perform in 2024 on back of bright spots such as data centre and AI demand
Industrial and data-centre REITs performed well during a turbulent year in 2023. These are sectors with structural growth where strong demand for assets and limited new supply resulted in high occupancy rates, positive rental reversions and distribution visibility. We believe the new economy story is still resilient, with data centre demand a bright spot.
While artificial intelligence (AI) is not a recent phenomenon, the rapid rise of consumer applications leveraging generative AI (e.g., ChatGPT) has seen AI emerge as a key market theme. The ongoing evolution of AI usage is expected to result in solid volume growth across the server industry in the next five years, with the AI service market, driven by AI-enabled hyperscalers, growing by an estimated 30% over that period.
As the server industry’s main growth driver changes from “storage” to “computing”, greater content expansion and demand for computing power should be positive for data centres.
The contribution to the data-centre market growth from AI demand is expected to expand at a compound annual growth rate of 86% over the next five years. It should make up around 36% of the market by 2028, compared to approximately 4% in 20235.
Colocation demand, which is capacity that is leased from a third-party data centre operator, is also forecast to increase (See Chart 9).
Chart 9: Global co-location (ex-AI) and AI demand market forecasted to rise
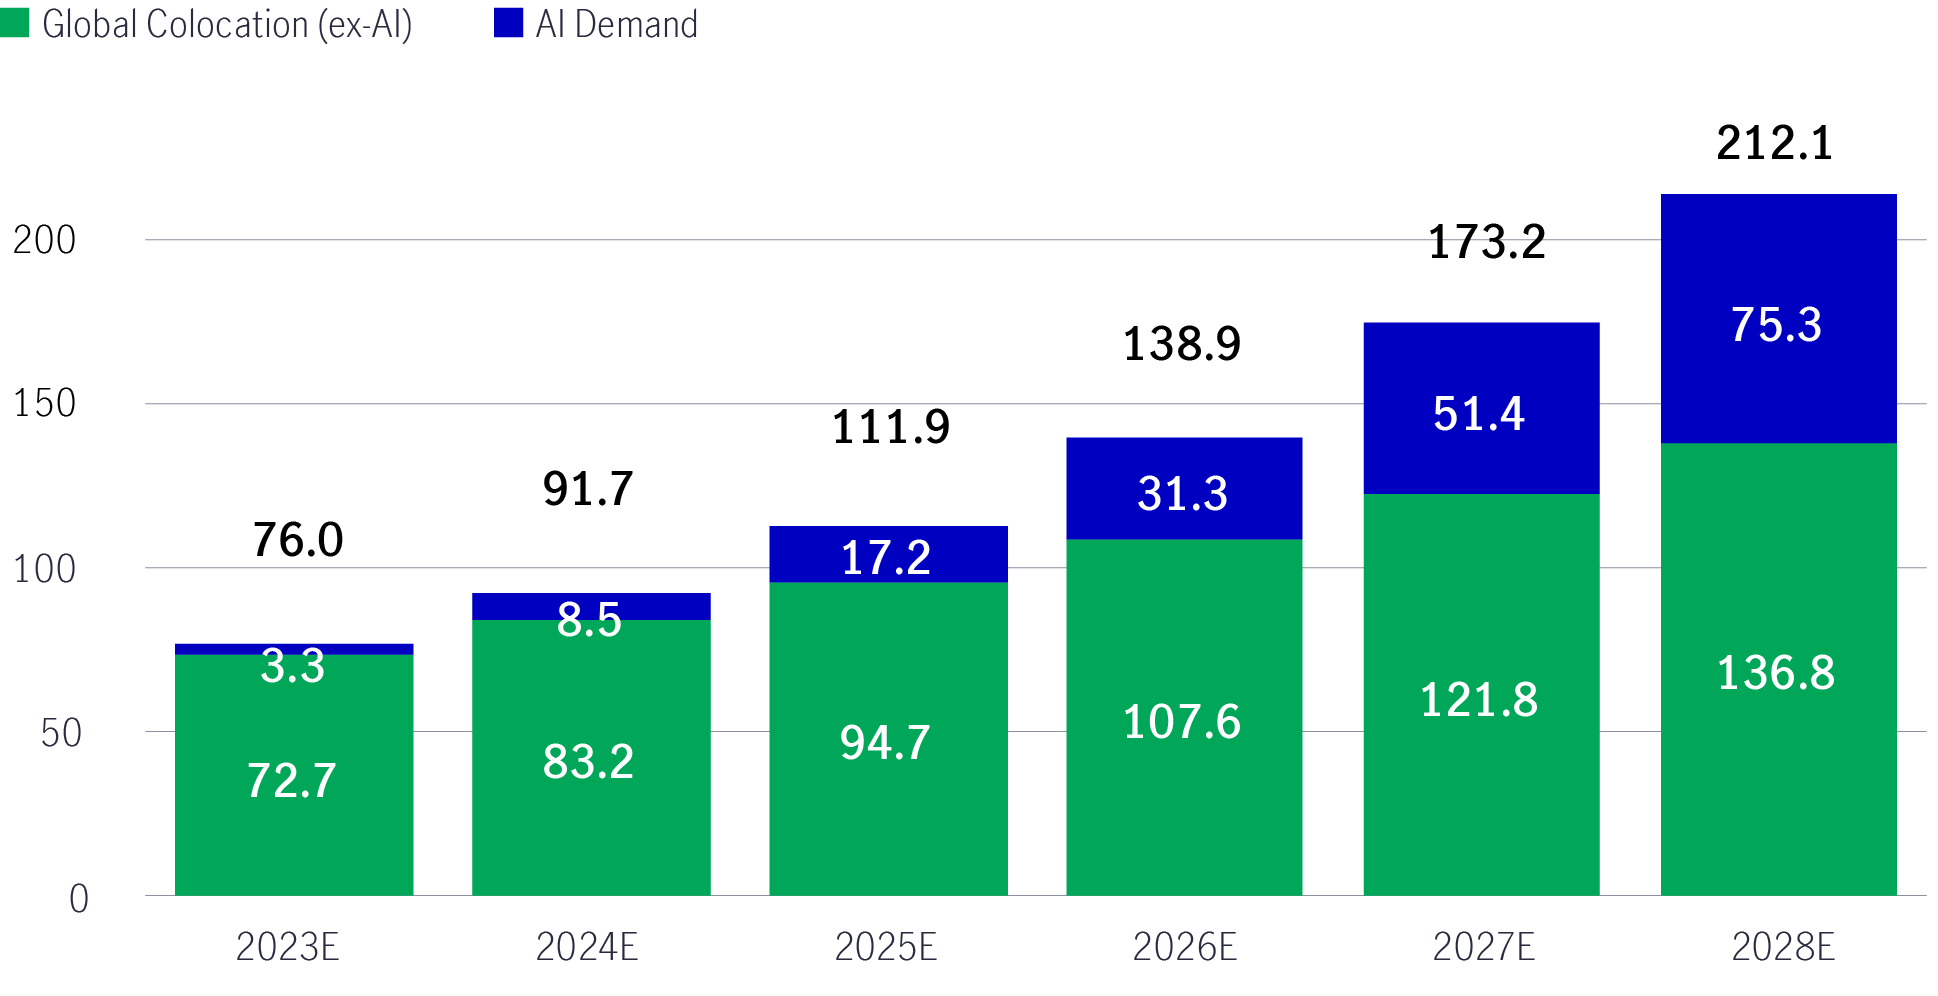
Source: Structure Research, January 2024. Note: Colocation – capacity that is leased from a third-party data centre operator.
While we are in the early stages of adoption, with use cases still fairly novel, the longer-term impact looks significant.
For industrial REITs, warehouse demand is expected to remain healthy, given the expansion of the logistics sector, with tenants still operating a just-in-case model. Considering where spot rents currently sit, this strong demand and improving occupancy should allow for positive rental reversions across the sector, driving organic growth (See Charts 10 and 11).
Charts 10 and 11: Lower supply with improving occupancy and stronger demand supports pricing
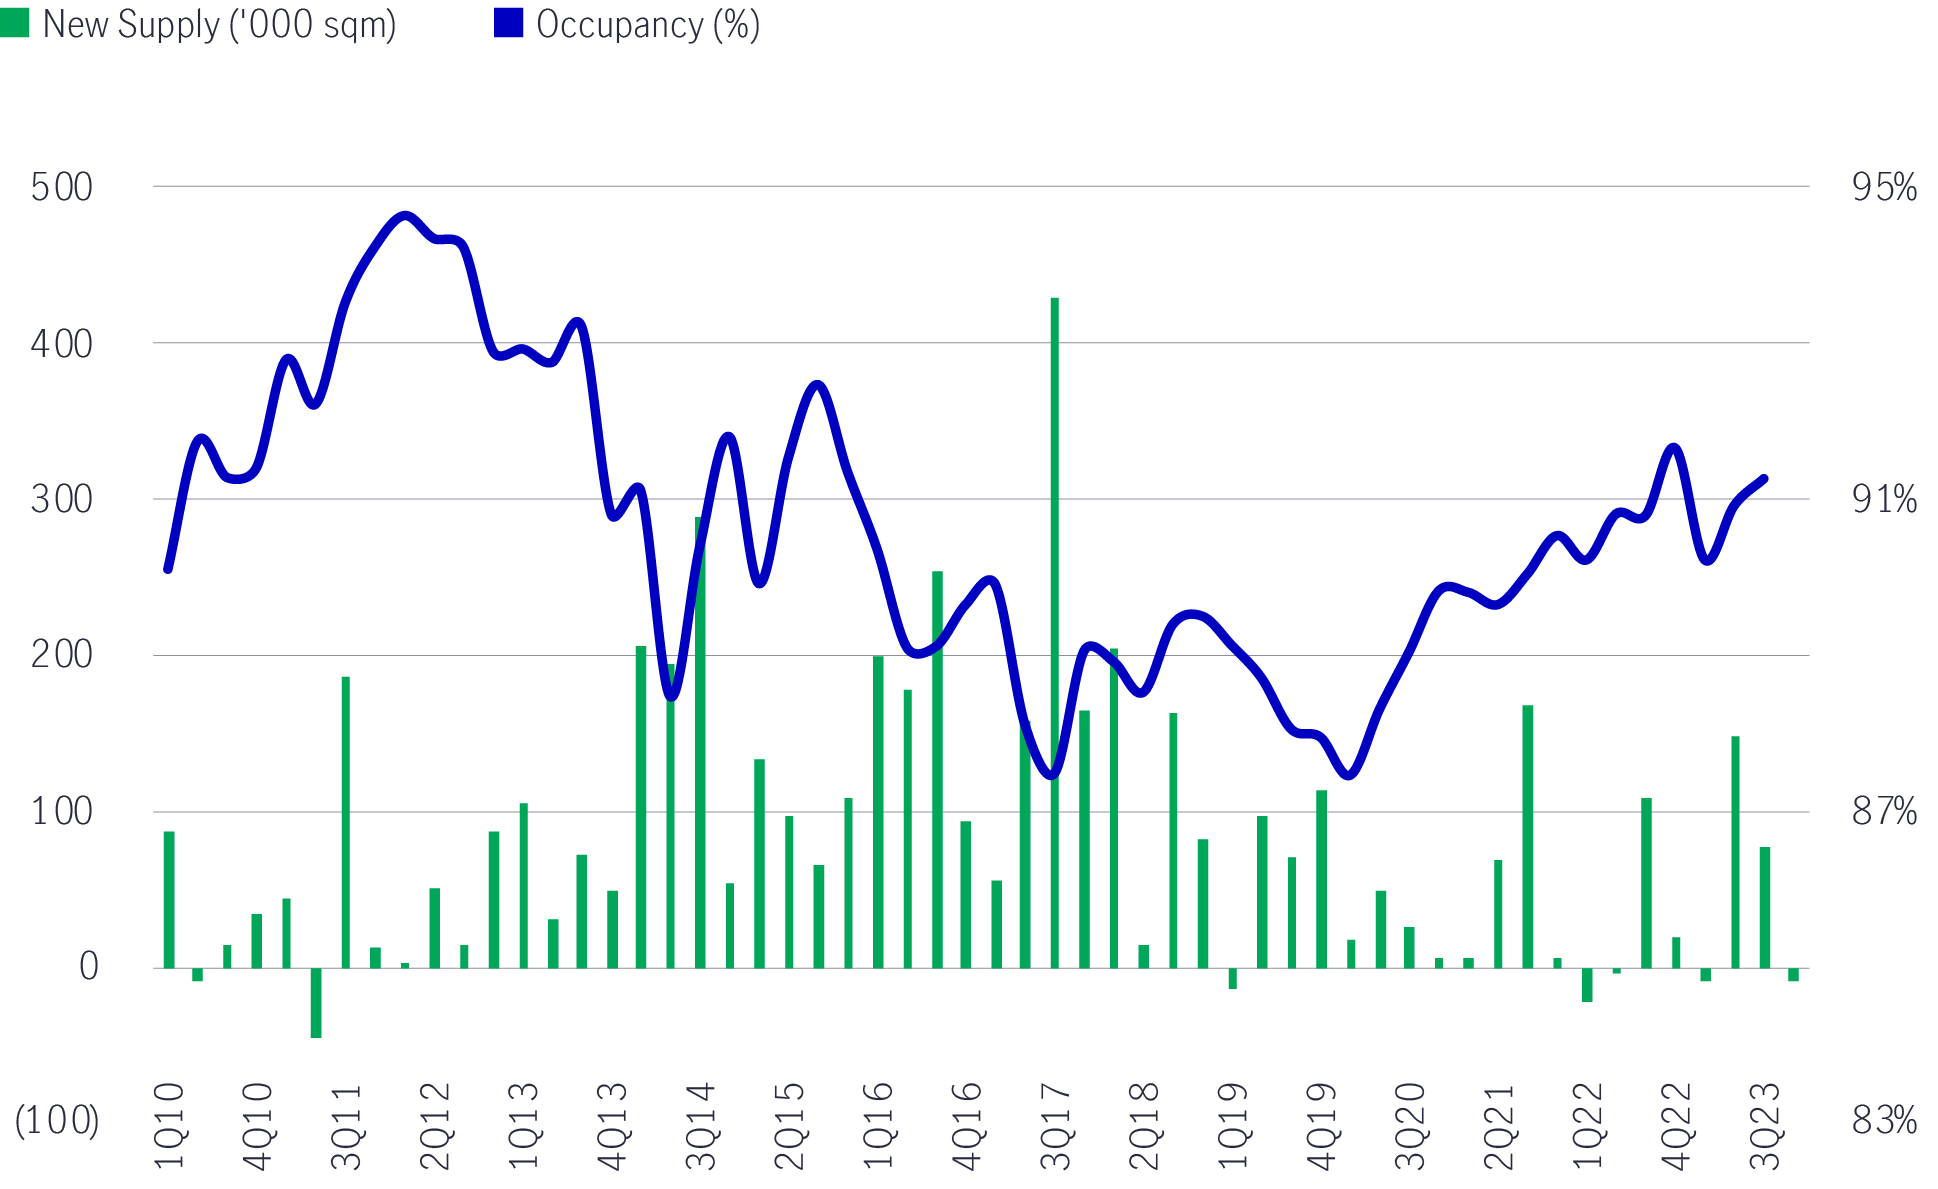
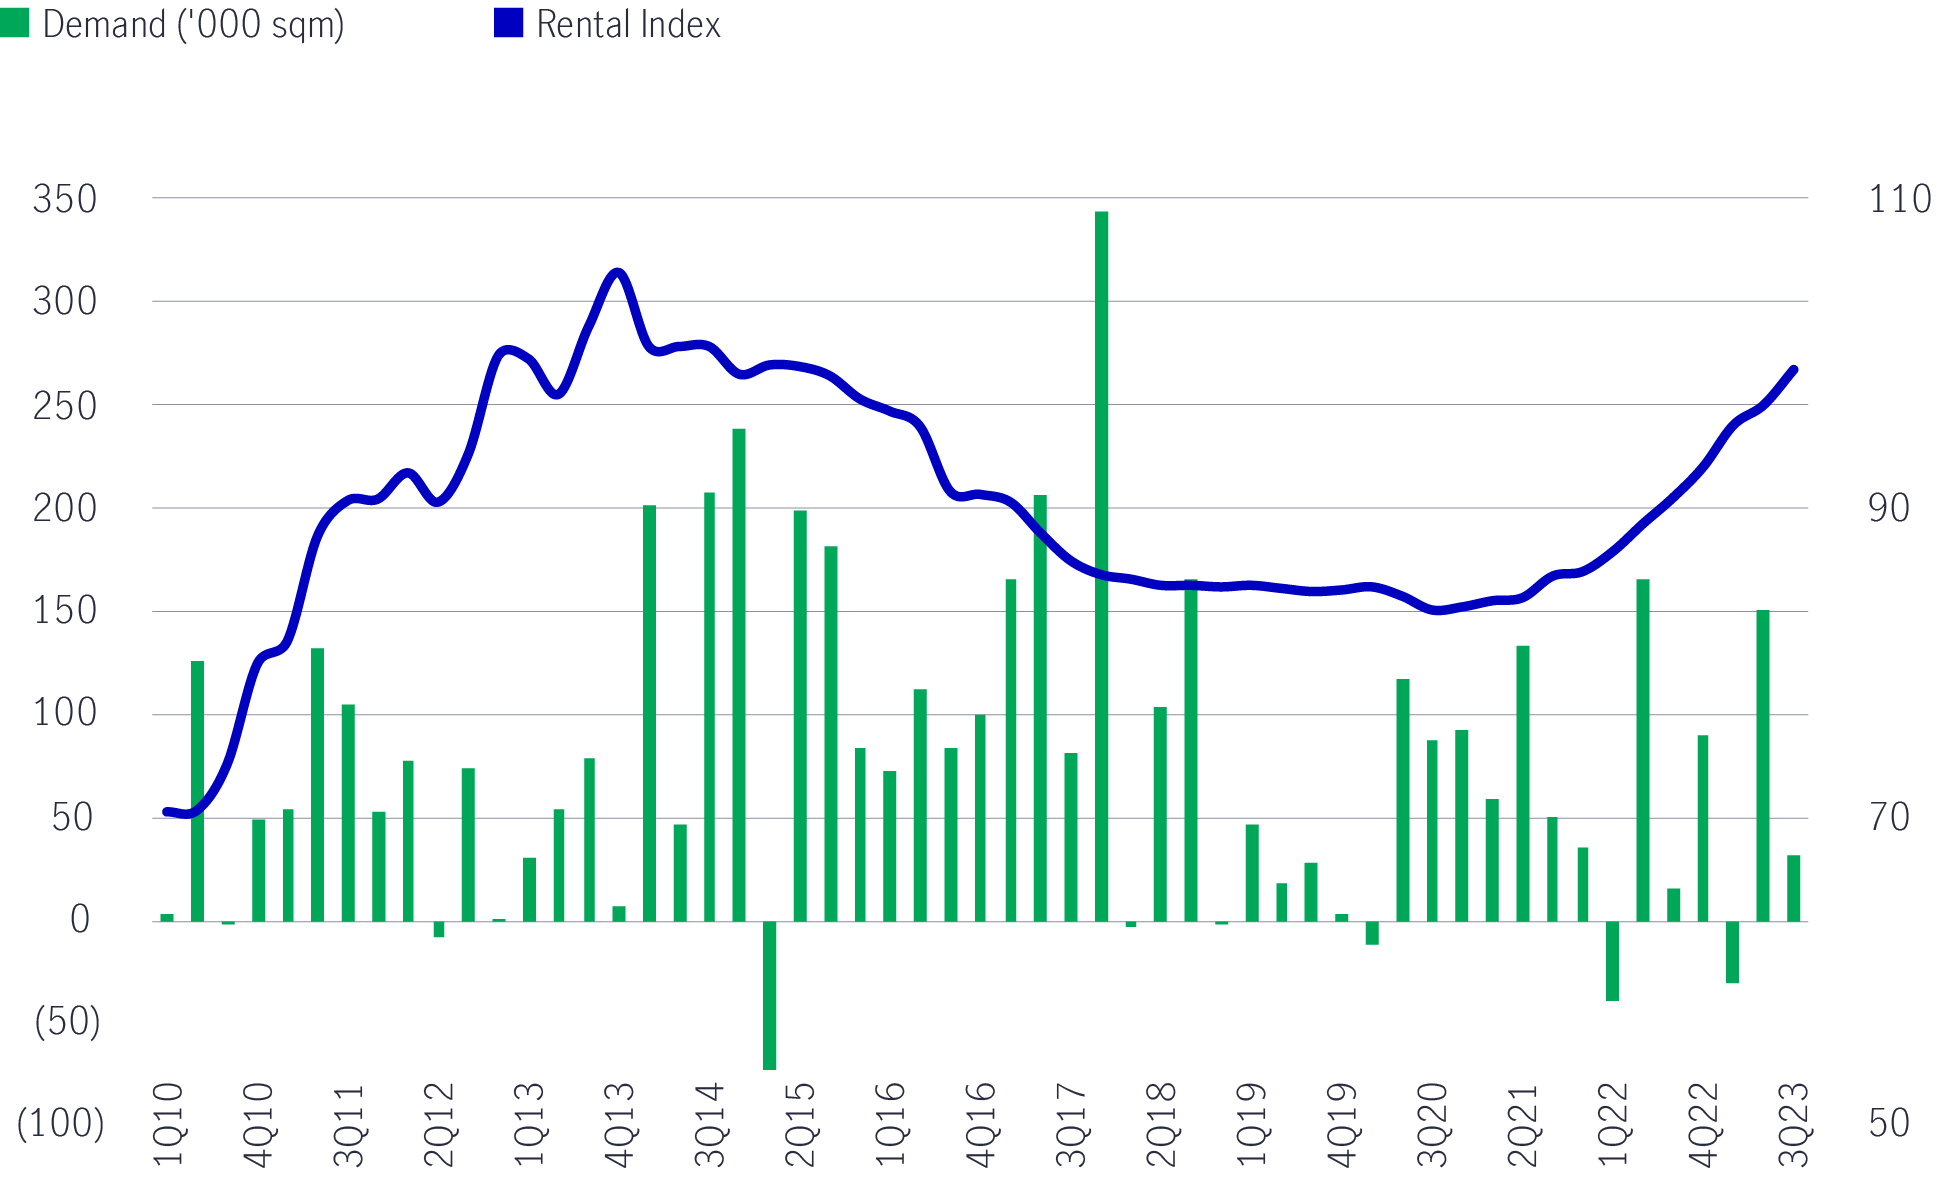
Source: DBS Bank, URA, January 2024.
Potential resumption of M&A activity
As rates peak and begin to move lower throughout 2024, lower financing costs could result in a revival of M&A activity, allowing REITs to seek inorganic growth opportunities. This could provide support for medium to long-term DPU growth. We believe lowly- geared REITs can deploy their balance sheet capacity to deliver DPU-accretive acquisitions. Real-estate fund managers should also benefit from a pickup in transactional activities.
Despite an easing of headline macro challenges, fundamental aspects that deserve monitoring are tenant renewal risk and default risk. These factors would directly impact cash flow, which would negatively affect distributions.
Interest rate normalisation should support REITs
Entering 2024, Asia REITs should perform marginally better, given relatively low market expectations, discounted valuations and low sector exposure by investors. With peak hawkishness likely behind us, a key macro pressure point weighing on Asia REITs should reverse in the year ahead, as shown by the Federal Open Market Committee’s ‘dot plot’ (See Chart 12). Resilient operating fundamentals should continue in key sectors, providing investors with unique income opportunities in 2024.
Chart 12: FOMC dot plot (as of December 2023 meeting)
Source: Bloomberg, January 2024.
1 Source: Bloomberg, as of 31 December 2023. Asia ex Japan- S&P Pan Asia Ex-JP, AU, NZ, PK REIT 10% Capped Index (USD) TR; Australia- S&P/ASX 200 A-REIT Index; Hong Kong- Hang Seng REIT Index; Singapore- FTSE ST All-Share Real Estate Investment Trusts Index SGD. 2 Source: FactSet, Manulife Investment Management, as of 31 December 2023. Index: S&P Pan Asia Ex-JP, AU, NZ, PK REIT 10% Capped Index (USD) TR. 3 Source: Bloomberg, as of 31 December 2023. Equity dividend: Australia- S&P/ASX 200; HK- Hang Seng Index; Singapore- Straits Times Index. REITs: Australia- S&P/ASX 200 A-REIT Index; HK- FTSE EPRA Nareit Developed REITs HONG KONG Total Return Index USD; Singapore- FTSE ST All-Share Real Estate Investment Trusts Index SGD. Fixed Income: Australia- 10-year government bond; HK- HKMA Hong Kong Government Bond Fixing 10 Year Yield. Singapore- Monetary Authority of Singapore Benchmark Govt Bond Yield 10 Year. 4 REIT 4 performance data starts from 2017. 5 Source: Structure Research and Manulife Investment Management, January 2024.
Investing involves risks, including the potential loss of principal. Financial markets are volatile and can fluctuate significantly in response to company, industry, political, regulatory, market, or economic developments. These risks are magnified for investments made in emerging markets. Currency risk is the risk that fluctuations in exchange rates may adversely affect the value of a portfolio’s investments.
The information provided does not take into account the suitability, investment objectives, financial situation, or particular needs of any specific person. You should consider the suitability of any type of investment for your circumstances and, if necessary, seek professional advice.
This material is intended for the exclusive use of recipients in jurisdictions who are allowed to receive the material under their applicable law. The opinions expressed are those of the author(s) and are subject to change without notice. Our investment teams may hold different views and make different investment decisions. These opinions may not necessarily reflect the views of Manulife Investment Management or its affiliates. The information and/or analysis contained in this material has been compiled or arrived at from sources believed to be reliable, but Manulife Investment Management does not make any representation as to their accuracy, correctness, usefulness, or completeness and does not accept liability for any loss arising from the use of the information and/or analysis contained. The information in this material may contain projections or other forward-looking statements regarding future events, targets, management discipline, or other expectations, and is only current as of the date indicated. The information in this document, including statements concerning financial market trends, are based on current market conditions, which will fluctuate and may be superseded by subsequent market events or for other reasons. Manulife Investment Management disclaims any responsibility to update such information.
Neither Manulife Investment Management or its affiliates, nor any of their directors, officers or employees shall assume any liability or responsibility for any direct or indirect loss or damage or any other consequence of any person acting or not acting in reliance on the information contained here. All overviews and commentary are intended to be general in nature and for current interest. While helpful, these overviews are no substitute for professional tax, investment or legal advice. Clients should seek professional advice for their particular situation. Neither Manulife, Manulife Investment Management, nor any of their affiliates or representatives is providing tax, investment or legal advice. This material was prepared solely for informational purposes, does not constitute a recommendation, professional advice, an offer or an invitation by or on behalf of Manulife Investment Management to any person to buy or sell any security or adopt any investment strategy, and is no indication of trading intent in any fund or account managed by Manulife Investment Management. No investment strategy or risk management technique can guarantee returns or eliminate risk in any market environment. Diversification or asset allocation does not guarantee a profit or protect against the risk of loss in any market. Unless otherwise specified, all data is sourced from Manulife Investment Management. Past performance does not guarantee future results.
Manulife Investment Management
Manulife Investment Management is the global wealth and asset management segment of Manulife Financial Corporation. We draw on more than a century of financial stewardship to partner with clients across our institutional, retail, and retirement businesses globally. Our specialist approach to money management includes the highly differentiated strategies of our fixed-income, specialized equity, multi-asset solutions, and private markets teams—along with access to specialized, unaffiliated asset managers from around the world through our multimanager model.
This material has not been reviewed by, is not registered with any securities or other regulatory authority, and may, where appropriate, be distributed by the following Manulife entities in their respective jurisdictions. Additional information about Manulife Investment Management may be found at manulifeim.com/institutional
Australia: : Manulife Investment Management Timberland and Agriculture (Australasia) Pty Ltd, Manulife Investment Management (Hong Kong) Limited. Canada: Manulife Investment Management Limited, Manulife Investment Management Distributors Inc., Manulife Investment Management (North America) Limited, Manulife Investment Management Private Markets (Canada) Corp. Mainland China: Manulife Overseas Investment Fund Management (Shanghai) Limited Company. European Economic Area: Manulife Investment Management (Ireland) Ltd. which is authorised and regulated by the Central Bank of Ireland Hong Kong: Manulife Investment Management (Hong Kong) Limited. Indonesia: PT Manulife Aset Manajemen Indonesia. Japan: Manulife Investment Management (Japan) Limited. Malaysia: Manulife Investment Management (M) Berhad 200801033087 (834424-U) Philippines: Manulife Investment Management and Trust Corporation. Singapore: Manulife Investment Management (Singapore) Pte. Ltd. (Company Registration No. 200709952G) South Korea: Manulife Investment Management (Hong Kong) Limited. Switzerland: Manulife IM (Switzerland) LLC. Taiwan: Manulife Investment Management (Taiwan) Co. Ltd. United Kingdom: Manulife Investment Management (Europe) Ltd. which
is authorised and regulated by the Financial Conduct Authority
United States: John Hancock Investment Management LLC, Manulife Investment Management (US) LLC, Manulife Investment Management Private Markets (US) LLC and Manulife Investment Management Timberland and Agriculture Inc. Vietnam: Manulife Investment Fund Management (Vietnam) Company Limited.
Manulife, Manulife Investment Management, Stylized M Design, and Manulife Investment Management & Stylized M Design are trademarks of The Manufacturers Life Insurance Company and are used by it, and by its affiliates under license.
3334079