






LDI in a stronger funded world: improving hedge design, benchmarks, and funded-status outcomes
With funded positions at historically strong levels, now is an opportune time to reassess whether your investment policy, liability hedge, and LDI approach remain aligned with your plan’s objectives.





Key takeaways
- With funded positions stronger than ever, it’s a good time for plans to shift focus from maximizing returns to protecting gains and improving contribution and balance-sheet stability
- For plans already using liability-driven investing (LDI), the next lever is refining hedge design and implementation to improve liability tracking and efficiency
- There’s a real opportunity now for plans to move from “LDI as a sleeve” to an objective-led, liability-benchmarked approach that ties hedge decisions directly to funded-status outcomes
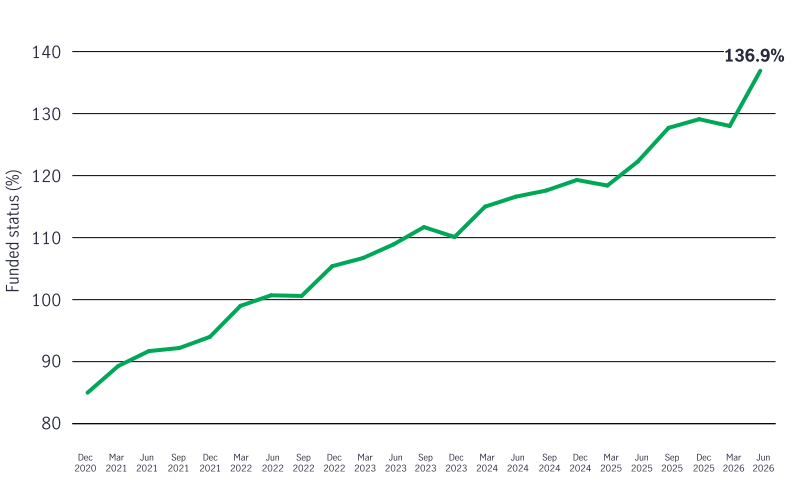
Canadian pension plans are at an important inflection point. After a prolonged bull market in equities and a bear market in bonds, strong growth-asset returns and higher discount rates have significantly improved funded positions. Solvency-funded levels have risen from 85% as of December 31, 2020, to 137% as of June 30, 2026. For many sponsors, this creates a timely opportunity to review investment policies and lock in gains that may have taken years to build.
Solvency ratio
The central question has therefore shifted from “How do we earn our way out?” to “How do we protect what we’ve earned?”, and for well-funded plans, the current environment offers an opportunity to compare the expected return and funded-status risk of their current policy with more liability-aware alternatives. Liability-driven investing (LDI) supports this objective by using the plan’s liabilities, rather than a broad market index, as the reference point for portfolio construction.
The starting point: a meaningful interest rate mismatch
The representative portfolio below is intended to resemble a diversified Canadian DB pension asset mix. Canadian plans vary by size, maturity, funded position, and risk tolerance, but typically combine equities for long-term growth, fixed income to help hedge liability risk, and real assets or other diversifiers to broaden sources of return. Industry data for 2025 shows this pattern clearly: Canadian DB assets were allocated approximately 40% to equities, 35% to fixed income, 20% to real assets, and 5% to diversifying strategies. The illustrative portfolio uses similar building blocks—40% equities, 40% fixed income, and 20% real assets—while keeping the analysis simple enough to show how each component contributes to growth, hedging, or diversification.
The table should be read as a starting allocation rather than a prescription for every plan. The two equity allocations provide the main source of return-seeking exposure; Canadian core and long core bonds serve as the principal liability-hedging assets; and real estate and infrastructure provide diversification and potential inflation sensitivity. Although 40% of the portfolio is invested in fixed income, its estimated interest rate hedge ratio is only 51.0%. The hedge ratio compares the portfolio’s sensitivity to interest rate changes with that of the liabilities: A 100% ratio would indicate that the asset and liability values are expected to respond similarly to a given rate movement. At 51.0%, roughly half of the liability’s interest rate sensitivity remains unhedged, leaving funded status exposed to changes in rates and the shape of the yield curve.
| Asset class | Role | Asset class weight |
| Canadian Core Fixed Income | Hedging | 20% |
| Canadian Long Core Fixed Income | Hedging | 20% |
| Canadian All Cap | Growth | 10% |
| Global AC Large Cap | Growth | 30% |
| Canadian Real Estate | Diversifying | 10% |
| Global Infrastructure | Diversifying | 10% |
The first comparison asks whether the existing 40% fixed income allocation can hedge liabilities more effectively without changing the overall asset mix. The conventional Canadian core and long core strategies are therefore replaced, at the same weights, with an LDI strategy. This isolates the effect of changing how the fixed income portfolio is constructed—from tracking broad market indices to targeting the plan’s liability exposures—rather than simply adding more bonds.
A closer liability match can improve portfolio efficiency
Using the same starting funded ratio of 136.9% at June 30, 2026, we keep the overall asset mix the same—40% in fixed income—but replace the Canadian core and long core bond allocations with a 40% LDI mandate. This lets us isolate what changes when fixed income is designed around liability exposures rather than a broad market index. The result is a higher interest-rate hedge ratio (about 51% to about 55%), meaning the portfolio should track liability movements more closely as interest rates and the yield curve change.
Risk return profile
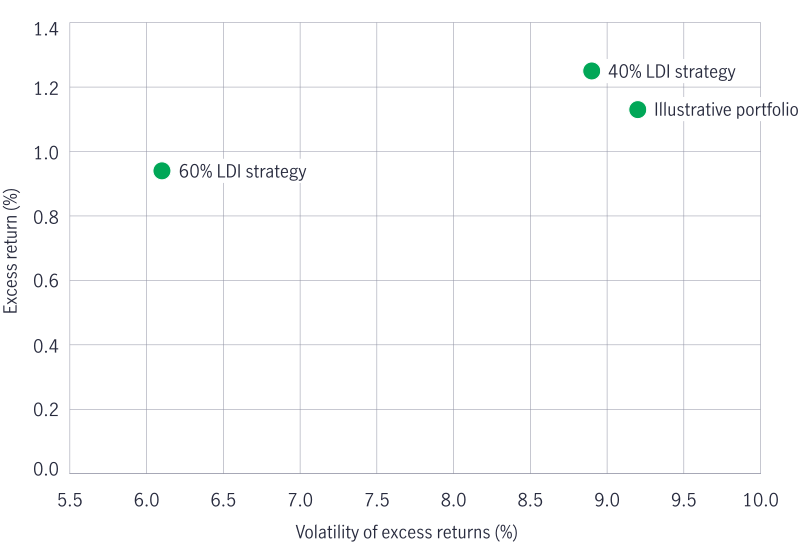
The modelling results are expressed as returns relative to the liabilities because this is how a pension sponsor ultimately experiences investment success. “Excess return” means the portfolio return above or below the change in liability value, while “excess-return volatility” measures how widely that relative outcome may vary. Over the 10-year horizon modelled, median annualized excess return rises from approximately 1.13% under the current allocation to 1.25% with LDI, while excess-return volatility declines from about 9.16% to 8.91%. In practical terms, the model indicates a modestly higher median return over liabilities with slightly less variability under this scenario.
A further 20% shift from equities to LDI strengthens the hedge
The second scenario illustrates a more deliberate derisking step. After replacing the original 40% conventional fixed income allocation with LDI, the LDI weight is increased by a further 20 percentage points, to 60% of the portfolio. The additional 20% comes from equities: The starting portfolio has 40% in Canadian and global equities, and this scenario reduces that combined equity allocation to 20%. In comparison, the 20% allocation to real estate and infrastructure remains unchanged. This is consistent with the spreadsheet weights and is important context—the larger risk reduction reflects both a closer liability match within fixed income and less exposure to equity-market volatility. Under this higher-LDI allocation, excess-return volatility falls to approximately 6.10%, and the hedge ratio rises to about 82.1%. Median excess return declines to approximately 0.94%, illustrating the modelled trade-off: lower median excess return in exchange for a narrower range of funded-status outcomes.
More LDI can materially reduce downside risk
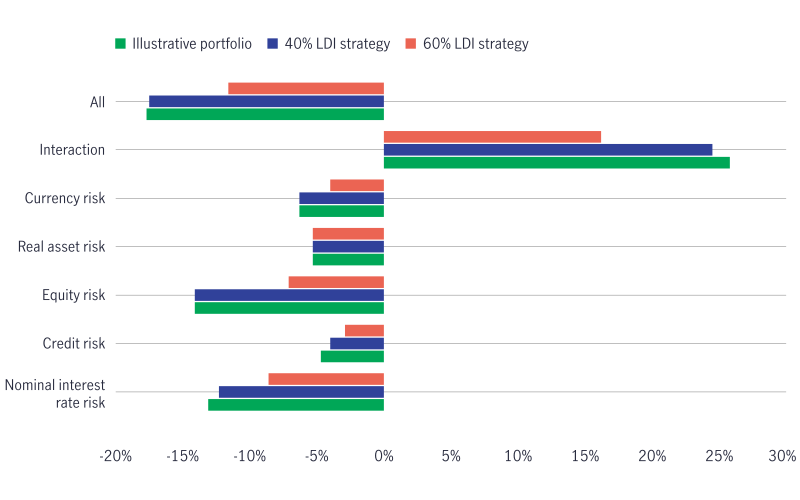
The value-at-risk (VaR) analysis provides another way to understand the potential effect on funded status. Rather than showing an expected outcome, it estimates the size of decline that could occur in a severe but plausible market environment. At the 95% confidence level used here, VaR estimates a severe-but-plausible decline in funded status: in 95 out of 100 scenarios, the loss is expected to be smaller than the VaR figure. Under the current allocation, the funded ratio falls by about 17.7 percentage points (from 136.9% to ~119.2%). Switching to LDI at the same weight modestly narrows this decline (~17.5 points), but moving to 60% LDI has a larger impact: The decline improves to ~11.6 points (to ~125.3%), reflecting lower equity exposure and less interest rate mismatch.
Value at risk 95 - change in funded status
Why a liability benchmark is a better fit
LDI is more than a change in bond allocation; it's a change in the framework used to define success. It treats the plan’s liabilities as the benchmark for investment and risk decisions rather than a public market index, typically separating the portfolio into liability-hedging and return-seeking components. Because duration, cash flow pattern, and yield curve exposures of a broad bond index can differ materially from those of a pension plan, a conventional index-benchmarked fixed income portfolio can perform well against its market benchmark while still diverging from the liabilities it's intended to hedge. That’s why we favour a custom liability benchmark that’s designed around a plan’s key-rate exposures, enabling the hedging portfolio to respond more consistently with changes in liability value as the yield curve moves.
For Canadian DB plans with stronger funded positions, the analysis provides a reason to review whether the current balance between equity exposure and liability hedging remains appropriate. The case doesn't depend on a forecast for interest rates. In the first scenario, replacing conventional fixed income with LDI at the same weight modestly raises the hedge ratio and median excess return while slightly reducing excess-return volatility. In the second scenario, increasing LDI to 60% by reducing equities further raises the hedge ratio and materially reduces modelled volatility and funded-ratio downside risk, but lowers the median excess return. These results don’t prescribe a single allocation. They illustrate the trade-off sponsors can assess when considering how much expected return to retain relative to the degree of liability alignment and funded-status risk they're prepared to accept.
Important disclosures
Important disclosures
Investing involves risks, including the potential loss of principal. Financial markets are volatile and can fluctuate significantly in response to company, industry, political, regulatory, market, or economic developments. These risks are magnified for investments made in emerging markets. Currency risk is the risk that fluctuations in exchange rates may adversely affect the value of a portfolio’s investments.
The information provided does not take into account the suitability, investment objectives, financial situation, or particular needs of any specific person. You should consider the suitability of any type of investment for your circumstances and, if necessary, seek professional advice.
This material is intended for the exclusive use of recipients in jurisdictions who are allowed to receive the material under their applicable law. The opinions expressed are those of the author(s) and are subject to change without notice. Our investment teams may hold different views and make different investment decisions. These opinions may not necessarily reflect the views of Manulife Investment Management or its affiliates. The information and/or analysis contained in this material has been compiled or arrived at from sources believed to be reliable, but Manulife Investment Management does not make any representation as to their accuracy, correctness, usefulness, or completeness and does not accept liability for any loss arising from the use of the information and/or analysis contained. The information in this material may contain projections or other forward-looking statements regarding future events, targets, management discipline, or other expectations, and is only current as of the date indicated. The information in this document, including statements concerning financial market trends, are based on current market conditions, which will fluctuate and may be superseded by subsequent market events or for other reasons. Manulife Investment Management disclaims any responsibility to update such information.
Neither Manulife Investment Management or its affiliates, nor any of their directors, officers or employees shall assume any liability or responsibility for any direct or indirect loss or damage or any other consequence of any person acting or not acting in reliance on the information contained here. All overviews and commentary are intended to be general in nature and for current interest. While helpful, these overviews are no substitute for professional tax, investment or legal advice. Clients should seek professional advice for their particular situation. Neither Manulife, Manulife Investment Management, nor any of their affiliates or representatives is providing tax, investment or legal advice. This material was prepared solely for informational purposes, does not constitute a recommendation, professional advice, an offer or an invitation by or on behalf of Manulife Investment Management to any person to buy or sell any security or adopt any investment strategy, and is no indication of trading intent in any fund or account managed by Manulife Investment Management. No investment strategy or risk management technique can guarantee returns or eliminate risk in any market environment. Diversification or asset allocation does not guarantee a profit or protect against the risk of loss in any market. Unless otherwise specified, all data is sourced from Manulife Investment Management. Past performance does not guarantee future results.
About Manulife Wealth & Asset Management
As part of Manulife Financial Corporation, Manulife Wealth & Asset Management provides global investment, financial advice, and retirement plan services to 19 million individuals, institutions, and retirement plan members worldwide. Our mission is to make decisions easier and lives better by empowering people today to invest for a better tomorrow. As a committed partner to our clients and as a responsible steward of investor capital, we offer a heritage of risk management, deep expertise across public and private markets, and comprehensive retirement plan services. We seek to provide better investment and impact outcomes and to help people confidently save and invest for a more secure financial future. Not all offerings are available in all jurisdictions. For additional information, please visit manulifeim.com.
This material has not been reviewed by, is not registered with any securities or other regulatory authority, and may, where appropriate, be distributed by the following Manulife entities in their respective jurisdictions. Additional information about Manulife Investment Management may be found at manulifeim.com/institutional
Canada: Manulife Investment Management Limited, Manulife Investment Management Distributors Inc., Manulife Investment Management (North America) Limited, Manulife Investment Management Private Markets (Canada) Corp.
Manulife, Manulife Investment Management, Stylized M Design, and Manulife Investment Management & Stylized M Design are trademarks of The Manufacturers Life Insurance Company and are used by it, and by its affiliates under license.
5900499