農地プラス戦略:農業バリューチェーンへの投資
オリバー・ウィリアムズ、CFA
農地投資グローバル・ヘッド
キース・バルター
マネージング・ディレクター、エコノミック・リサーチ
ダニエル・セルナ
アソシエート・ディレクター兼シニア・ポートフォリオ・マネージャ
【日本語抄訳】
・農地プラス戦略とは、従来型のコア農地投資に加えて、農産物の加工や販売を手掛ける企業や資産への投資を組み合わせたものであり、農業のバリューチェーンへの投資を通じて投資可能ユニバースを拡大することができます。
・農地プラス戦略は、プライベート・エクイティのような単独の投資ではなく、生産から加工、販売といった農業関連資産の垂直統合を目指すものです。リスク・リターンは、コア農地投資とプライベート・エクイティ投資との中間程度が想定されます。
・コア農地投資戦略に農地プラス戦略を組み合わせることで、ビジネスの分散、サプライチェーンの効率化、消費者嗜好に合わせたプロダクトミックスなどを通じ、農地投資のリターンのボラティリティ低減が期待できます。
【英語原文】
Farmland plus: investing in the agricultural value chain
Combining "farmland plus" with traditional farmland investment strategies can provide investors with a host of potential benefits.
Farmland plus refers to investments in companies and assets that combine farm production with processing and marketing, and substantially expands the range of investment options beyond pure farmland investments. Food and beverage processing contributed $274 billion to U.S. GDP in 2020, and more than 31,000 companies operate over 36,000 food and beverage processing facilities.1 Food and beverage manufacturing comprises about 12% of all value added in the U.S. manufacturing sector.2
The agriculture value chain begins with farm inputs and extends to the consumer, encompassing growing, processing, marketing, and distribution of the full range of agricultural products. The complete farm-to-consumer value chain is estimated to have contributed $1.0 trillion to U.S. GDP in 2020.3
Components by sector of the U.S. agricultural supply chain are illustrated below, with the two largest sectors, food service and food processing, together representing 65% of the total value of the supply chain, compared to just 13% for farm production.4
U.S. agriculture supply chain, value added to GDP by industry ($US billion)
Food and beverage manufacturing is the second-largest industry in the U.S. food supply chain.

Source: U.S. Bureau of Economic Analysis, March 25, 2021.
U.S. food and beverage product industry composition by value added to GDP
Crop processing and manufacturing comprises one-third of U.S. food and beverage manufacturing.

This compares to the $138 billion added to GDP by the U.S. farm sector. Significant portions of the food and beverage processing sector clearly fall outside the bounds of farmland plus, including bakery, beverage, and livestock products. Even limiting farmland plus to processing and services more directly associated with crop production, we believe the potential investment opportunities in farmland plus assets represent significant value in the market.
The scale of the farmland plus opportunity set is indicated by data from the debt market. The Farm Credit System is the largest lender to agriculture in the United States, and in 2020, loans to agribusiness at $56 billion, and to infrastructure at $35 billion, comprised a total of 29% of all Farm Credit System loans. This compares to $206 billion in Farm Credit loans collateralized by farmland or designated for farm production (65%).5
U.S. Farm Credit System gross loan volume at year end ($US billion)
Agribusiness financing through the Farm Credit System exceeds $56 billion.

Source: Farm Credit Funding Corporation, March 25, 2021.
Farmland plus: opportunities at the interface of farmland and crop markets
Farmland plus investments aren’t conceived as stand-alone private equity, but focus on integration across agricultural assets, combining production, processing, and marketing. Potential target companies in a farmland plus strategy tend to be farmland-centric with vertically integrated operations.
Investments in farmland plus companies can build on and augment existing returns from farmland properties, facilitating improvements in the quality and product mix to align more closely with consumer preferences and trends. Consumer preferences for protein, freshness, convenience, sustainability, and food traceability and transparency are all affecting agricultural supply chains. For rapidly growing markets, such as specialty, niche, or organic crops, farmland plus investments can be directed to necessary additions to agricultural infrastructure, such as sorting, manufacturing, and storage facilities, or improvements to marketing and distribution channels.
Potential farmland plus opportunities

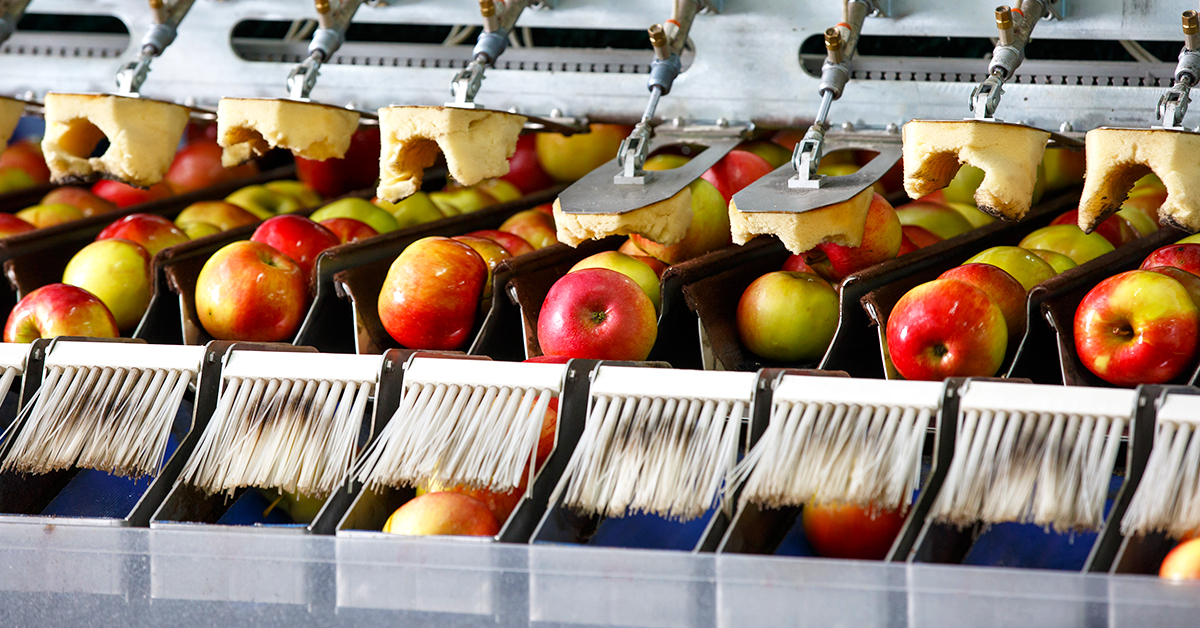
One example of a farmland plus project is an enterprise in Washington managed by Hancock Natural Resource Group (HNRG), part of Manulife Investment Management's comprehensive private markets strategies. This enterprise consists of apple orchards, an apple processing/cold storage facility, and an interest in a marketing desk selling fresh fruits to retail outlets. This vertical integration of the orchards with processing and cold storage has the potential to reduce return volatility relative to an orchard-only investment by eliminating supply chain expenses and balancing crop prices and processing volume income, as apple prices and packinghouse volumes may move inversely in the short run. The incorporation of the marketing desk into the enterprise provides a direct link to current market preferences together with consumer-directed insight into preference shifts to newer apple varieties that can command premium pricing, generating higher returns. The integration of marketing increases the efficiency of the sales process while also informing the strategy for redevelopment of orchards; this provides insight into the targeted varietal, fruit harvest timing, and product mix that has the potential to deliver optimal return performance.
Another example involves HNRG cranberry production in Quebec, Canada: Instead of selling cranberries raw from the bog, HNRG developed a cleaning and freezing facility that reduces the time from bog to freezer, maintaining the quality fruit destined for manufacturing into sweetened, dried cranberries by keeping the berries firmer. This integration of the cranberry bogs with first-stage processing provides an improved product to key downstream customers while enabling the crop to be more effectively marketed over the course of the year rather than concentrating sales at the time of harvest, when markets are often oversupplied, and pricing challenged.
Market conditions favoring a farmland plus strategy
A farmland plus strategy may provide an impact on crop types where genetics and production techniques are changing rapidly to meet shifting consumer preferences, requiring capital to fund advances and improvements. Crops where access to certain desired varietals and nursery stock are restricted also present opportunities for farmland plus investments to integrate the sources of these improved stock with farmland and farm management. Finally, fragmented sectors and geographies with smaller farms can be combined with centralized processing and marketing to generate production efficiencies and help niche crops achieve more consistent supply and a more prominent market position in retail channels.
Potential benefits for farmland investors
Traditional farmland investment strategies that include associated opportunities falling within the farmland plus category may provide investors with a number of potential benefits; a broader investable universe, potential to achieve greater supply chain efficiencies, and access to enhanced market information that informs operational decisions.
- Widening the investment mandate to include companies involved in processing and marketing agricultural products may allow access at scale to market segments that would be challenging to enter through ownership of farmland property alone.
- Combining production agriculture with storage and processing can unlock efficiencies by providing the tools to better optimize the mix and timing of crops marketed for sale.
- A feedback loop of market information back to farm operations can help adjust crop mix, quality, and sustainability to better meet the needs of other value chain stakeholders.
Historical returns and standard deviation, 1996–2020
The role of farmland plus in an agricultural portfolio.

Source: Data for timberland refers to the NCREIF Timberland Index, December 31, 2020. Data for farmland refers to the NCREIF Farmland Index, December 31, 2020. Data for commercial real estate refers to the NCREIF Property Index, December 31, 2020. Data for non-U.S. equities refers to the MSCI EAFE International Equities Index, December 31, 2020. Data for U.S. Treasury bills refers to the Ibbotson series IA SBBI U.S. 30 Day Tbill TR USD, December 31, 2020. The S&P 500 series is from Standard & Poor’s Financial Services LLC, December 31, 2020. Data for U.S. private equity refers to the Cambridge Associates Private Equity Index, December 31, 2020.
We believe farmland plus investments fit between farmland and private equity on the risk/return spectrum with a lower leverage, return and risk profile than private equity since farmland and real assets comprise a significant portion of the operating companies’ balance sheets. These assets contribute to the company's sales and add valuation stability relative to the operating company only. Investment assets and companies feed underlying markets for essential food and agricultural products, aligning with fundamentals similar to those of farmland and directly operated agricultural investments.
An important feature of food production and processing supply chain components is the margin fluctuations that occur due to changing farm product prices. An increase in farm product prices often boosts farm income but compresses margins for food processors as their costs rise. Likewise, a fall in commodity prices often reduces farm income, but expands food processing margins.
Annual % change in value added to U.S. GDP by key sectors in food supply chain
Farm production and food and beverage processing can offset each other during cycles.

Source: U.S. Bureau of Economic Analysis, March 25, 2021.
Investors in agriculture have the opportunity to pair real asset investments in farmland with operating companies within the food value chain, with the potential to add value to farm crops through processing and marketing as the crop aligns more closely with consumer preferences.
Where innovation meets demand
We've examined how farmland plus, paired with a portfolio of farmland properties, broadens the investable universe and provides the potential to increase income and reduce volatility by enhancing supply chain efficiency, product quality, and alignment with consumer trends. Furthermore, new processing plant technologies and economies of scale are producing efficiency gains that can benefit the overall supply chain, from agricultural production to consumers. And an increased focus on health and wellness, and on sustainability, is driving innovation and transformation across a range of crops and foods, creating a need for additional investment in these typically capital-intensive food and agriculture companies.
Continued innovation in agriculture production and processing, combined with shifting consumer trends towards fresh and healthy foods in the United States and globally, creates a need for capital in companies that combine agricultural production with processing and/or marketing. This is when an appropriately structured farmland plus investment strategy can help streamline costs and timing from farm to market, align supply chain interests, and facilitate the implementation of long-term initiatives in quality, sustainability, and traceability.
1 U.S. Census Bureau, October 26,2020. 2 USDA Economic Research Service, March 25, 2021. 3 U.S. Bureau of Economic Analysis, March 25, 2021. 4 USDA Economic Research Service. 5 Farm Credit Funding Corporation, March 25, 2021.
リスクと手数料
リスクと手数料については、以下をご覧ください。https://www.manulifeim.com/institutional/jp/ja/jp-risks-and-fees-guide
ディスクレーマー
- 本資料は、海外グループ会社の情報を基にマニュライフ・インベストメント・マネジメント株式会社(以下「当社」といいます。)が作成した情報提供資料です。
- 参考として掲載している個別銘柄を含め、当社が特定の有価証券等の取得勧誘または売買推奨を行うものではありません。
- 本資料は、信頼できると判断した情報に基づいておりますが、当社がその正確性、完全性を保証するものではありません。
- 本資料の記載内容は作成時点のものであり、将来予告なく変更される場合があります。
- 本資料のいかなる内容も将来の運用成果等を示唆または保証するものではありません。
- 本資料に記載された見解・見通し・運用方針は作成時点における当社の見解等であり、将来の経済・市場環境の変動等を示唆・保証するものではありません。
- 本資料で使用している指数等に係る著作権等の知的財産権、その他一切の権利は、その開発元または公表元に帰属します。
- 本資料の一部または全部について当社の事前許可なく転用・複製その他一切の行為を行うことを禁止させていただきます。
マニュライフ・インベストメント・マネジメント株式会社
金融商品取引業者 関東財務局長(金商)第433 号
加入協会: 一般社団法人 投資信託協会 一般社団法人 日本投資顧問業協会 一般社団法人 第二種金融商品取引業協会
世界的なパンデミックなどの公衆衛生危機は、市場のボラティリティの大幅な上昇、証券取引の停止等の原因となり、ポートフォリオのパフォーマンスに影響を及ぼす可能性があります。例えば、新型コロナウイルス感染症(COVID-19)は、世界の経済活動に深刻な打撃を与えています。将来、発生する可能性のある公衆衛生危機、およびその他のエピデミックやパンデミックは、現時点では必ずしも予測可能ではない影響をグローバル経済に与える可能性があります。公衆衛生危機は、既存の政治的、社会的、経済的リスクを悪化させる恐れがあります。こうした事象はポートフォリオのパフォーマンスに悪影響を与え、投資に損失が生じる可能性があります。
投資には、元本割れなどのリスクが伴います。金融市場は変動しやすく、企業、産業、政治、規制、市場又は経済の変化に応じて乱高下することがあります。エマージング市場での投資に関しては、これらのリスクはより大きくなります。為替リスクとは、為替レートの変動がポートフォリオの投資の価値に悪影響を及ぼすことがあるというリスクです。
掲載されている情報は、特定の人に係る適合性、投資目的、経済状態又は特定のニーズを考慮したものではありません。お客様自身の状況にどのような種類の投資が適しているかどうかを検討し、必要に応じて専門的アドバイスを求めることをお勧めします。
本資料は、利用者に関係する法域に適用される法令等に基づき受領を許可された者のみの利用に供することを目的として、マニュライフ・インベストメント・マネジメントが作成したものです。本資料に掲載された見解は、公表時におけるマニュライフ・インベストメント・マネジメントの見解であり、市場環境その他の状況に基づき変更される場合があります。本資料に掲載されている情報及び/又は分析は、信頼性があると思われる情報源から入手したものですが、マニュライフ・インベストメント・マネジメントは、当該情報及び/又は分析の精度、正確性、実用性又は完全性について何らの表明も行わず、当該情報及び/又は分析を使用したことによる損害について一切責任を負いません。本資料の情報には、将来の事象、目標、運用哲学その他の予想に関する予測や見通しについての記述が含まれていることがありますが、いずれの情報も表示されている日付時点での最新の内容です。本資料における情報(金融市場の動向に関する説明など)は現在の市況に基づいていますが、現在の市況は今後の市場での出来事その他の理由によって変動し、置き換えられる可能性があります。マニュライフ・インベストメント・マネジメントは、かかる情報を更新するいかなる責任も負いません。
マニュライフ・インベストメント・マネジメント若しくはその関連会社、又はマニュライフ・インベストメント・マネジメント若しくはその関連会社の取締役、執行役若しくは従業員のいずれも、本資料の情報を信頼して行動し又は行動しなかった人が直接又は間接的に被った損失、損害その他の結果に関する責任を負うものではありません。全ての見解及び解説は、一般的な性質を有するように意図されており、現時点の関心事に資するためのものです。これらの見解は有用であると考えていますが、税務、投資又は法務に関する専門的アドバイスに代わるものではありません。お客様固有の事情につきましては、お客様自身が適切な専門家のアドバイスを受けることをお勧めいたします。マニュライフ若しくはマニュライフ・インベストメント・マネジメント又はマニュライフ若しくはマニュライフ・インベストメント・マネジメントの関連会社若しくは代表者のいずれも、税務、投資又は法務に関するアドバイスを提供するものではありません。過去の実績は将来の結果を保証するものではありません。本資料は、もっぱら情報提供を目的として作成されており、有価証券の売買又は投資戦略の採用につき、マニュライフ・インベストメント・マネジメント又はその代理人が推奨したり、専門的アドバイスを提供したり、申込み又は勧誘したりするものではありません。また、マニュライフ・インベストメント・マネジメントが管理するファンド又は口座における取引の意図を示すものでもありません。いかなる市場環境においてもリターンを保証し又はリスクを排除する投資戦略又はリスク管理手法はありません。分散投資又はアセット・アロケーションによって、いかなる市場においても、利益が保証されることはなく、損失から保護されることもありません。別途示している場合を除き、全てのデータの出所はマニュライフ・インベストメント・マネジメントです。
マニュライフ・インベストメント・マネジメントについて
マニュライフ・インベストメント・マネジメントは、Manulife Financial Corporationのグローバルな資産運用ビジネス部門です。私たちは150年超にわたり、スチュワードシップ責任に則って、年金基金、機関投資家、個人投資家の皆さまに包括的な資産運用ソリューションをご提供しています。資産運用における私たちの専門的なアプローチには、債券、株式、マルチアセット及びプライベート・アセットの各運用チームが提供する高度に差別化された戦略があり、それらに加えて、私たちのマルチマネジャー・モデルを通じて特色ある独立系資産運用会社の戦略へのアクセスも可能です。
これらの資料は、有価証券その他の規制当局に審査及び登録されていませんが、以下のマニュライフ・グループの会社がそれぞれの法域で適宜配布することもあります。マニュライフ・インベストメント・マネジメントに関する追加情報については、次のURLに掲載されています。www.manulifeim.com/institutional
オーストラリア: Hancock Natural Resource Group Australasia Pty Limited, Manulife Investment Management (Hong Kong) Limited. ブラジル: Hancock Asset Management Brasil Ltda. カナダ: Manulife Investment Management Limited, Manulife Investment Management Distributors Inc., Manulife Investment Management (North America) Limited, Manulife Investment Management Private Markets (Canada) Corp. 中国: Manulife Overseas Investment Fund Management (Shanghai) Limited Company. 欧州経済領域(EEA)及び英国: Financial Conduct Authority (FCA) 規制下にあるManulife Investment Management (Europe) Limited、アイルランド中央銀行の規制下にあるManulife Investment Management (Ireland) Limited 香港特別行政区: Manulife Investment Management (Hong Kong) Limited. インドネシア: PT Manulife Aset Manajemen Indonesia. 日本:マニュライフ・インベストメント・マネジメント株式会社 マレーシア: Manulife Investment Management (M) Berhad(旧Manulife Asset Management Services Berhad)登録番号:200801033087 (834424-U) フィリピン: Manulife Asset Management and Trust Corporation. シンガポール: Manulife Investment Management (Singapore) Pte. Ltd.(会社登記番号:200709952G) スイス: Manulife IM (Switzerland) LLC. 台湾: Manulife Investment Management (Taiwan) Co. Ltd. 米国: John Hancock Investment Management LLC, Manulife Investment Management (US) LLC, Manulife Investment Management Private Markets (US) LLC and Hancock Natural Resource Group, Inc. ベトナム: Manulife Investment Fund Management (Vietnam) Company Limited.
Manulife Investment Management. All rights reserved. Manulife Investment Management及びMのデザイン、並びにManulife Investment ManagementとMのデザインの組み合わせは、The Manufacturers Life Insurance Companyの商標であり、同社のみならず、ライセンスに基づき同社の関連会社にも使用されています。